
Figure 5:
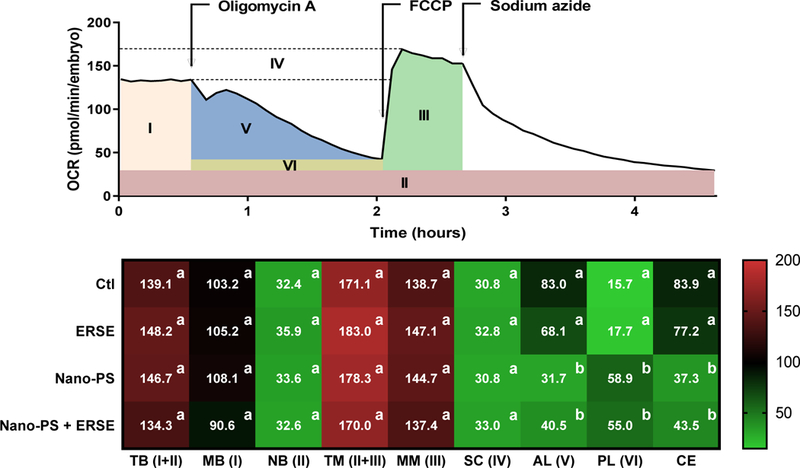
Mitochondrial bioenergetics in zebrafish embryos exposed to 44 nm nanopolystyrene particles (Nano-PS) in the presence of a real world environmental PAH mixture (Elizabeth River Sediment Extract – ERSE). Animals were co-exposed at 6 hours post fertilization (hpf) to 10 ppm Nano-PS and/or 2% ERSE. Oxygen consumption rate (OCR) was assessed in vivo at 24 hpf. The top panel depicts the use of chemical agents to increase mitochondrial OCR to its maximal (FCCP), to completely block it (sodium azide), or to block only the mitochondrial ATP-linked OCR (oligomycin A), and the subsequent division of organismal bioenergetics into different categories (I – VI). Further details are provided in Fig. S1 and the OCR values overtime are shown in Fig. S7. The heatmap below shows the mean values (n = 20–23) for each bioenergetics fraction (with Roman numerals indicating the corresponding fraction in the top panel) as follow: TB (total basal), MB (mitochondrial basal), NB (non-mitochondrial basal), TM (total maximal), MM (mitochondrial maximal), SC (mitochondrial spare capacity), AL (ATP-linked) and PL (proton leak), while CE indicates the estimated mitochondrial coupling efficiency. Data were analyzed by two-way ANOVA followed by Tukey’s posthoc. Groups with different letters are significantly different from each other (p < 0.001). All parameters are shown as OCR (pmol/min/embryo), except for CE which is shown as percentage. Please note that the top panel indicates the use of oligomycin A, FCCP and sodium azide in a single experiment, but oligomycin A and FCCP were used in separate experiments to avoid possible interference on OCR values.