Figure 1:
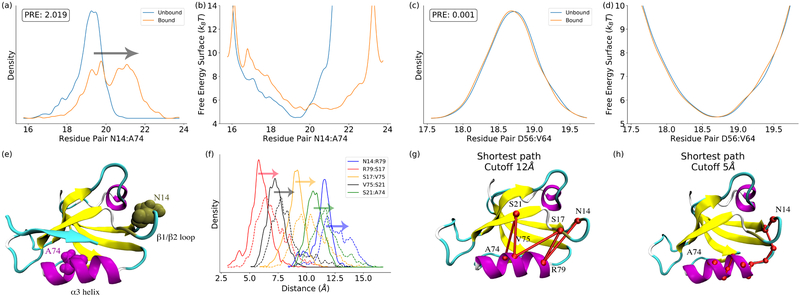
The significance of distribution changes and free energy surface changes quantified by perturbation relative entropy (PRE). (a) Residue pair (N14:A74) with the highest PRE in the protein; (b) The free energy surface of the N14:A74 distance distribution; (c) The residue pair (D56:V64) with the lowest PRE; (d) The free energy surface of the D56:V64 distance distribution; (c) Residues N14 and A74 illustrated in PDZ2; (d) Pathway decomposition: the distributions for decomposed residue pairs; (e) Pathway decomposition analysis of N14:A74 pair with cutoff value as 12Å; (f) Pathway decomposition analysis of N14:A74 pair with cutoff value as 5Å. These results demonstrate that the PRE is an effective measurement to quantify allosteric effect as residue pair level.

