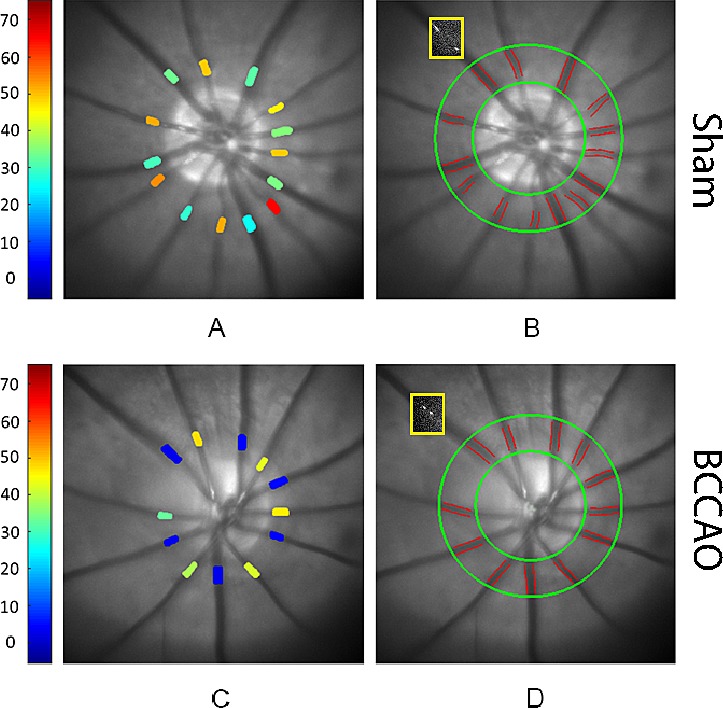
Figure 1.

Methodology of oxygen tension and blood flow imaging performed within 30 minutes of sham procedure or bilateral common carotid artery occlusion (BCCAO) by ligation in rats. Retinal vascular oxygen tension measurements are displayed in pseudo color in rats from (A) sham and (C) ligation groups. Color bar shows oxygen tension values in mmHg. Automatically detected retinal vessel boundaries are outlined on red-free retinal images in rats from (B) sham and (D) ligation groups. The position of one intravenous microsphere at two time points is displayed as overlaid on the red-free retinal images (yellow boxes). Note reduced blood velocity can be visualized in the rat from the BCCAO group (D) compared to the rat from the sham group (B) by the shorter distance the microsphere traveled during the same time interval.
