Figure 5.
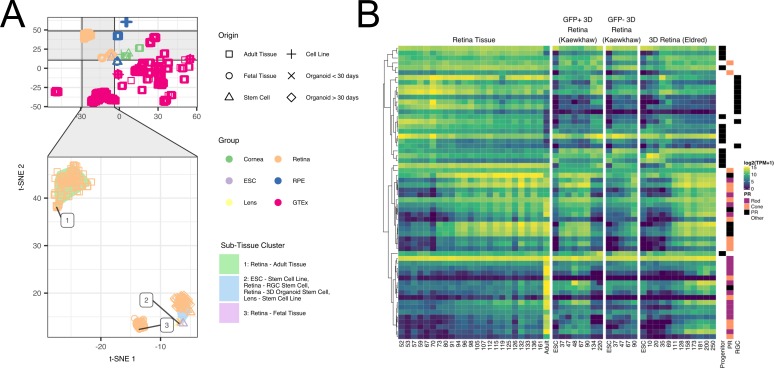
Organoid retina, stem cell retina, and fetal retina tissue have highly similar transcriptomes. The zoom inset (A) shows the retina samples. The “Subtissue Cluster” shading shows the cluster membership of the three major groups. The shapes of the points show the different origin types – notable types include the square for adult, the ‘X' for organoid under 30 days of differentiation, and the diamond for organoid over 30 days of differentiation. (B) Major markers of retina progenitor, photoreceptors (cone and rod), and RGCs have similar gene expression patterns across development in retina fetal tissue and organoids.

