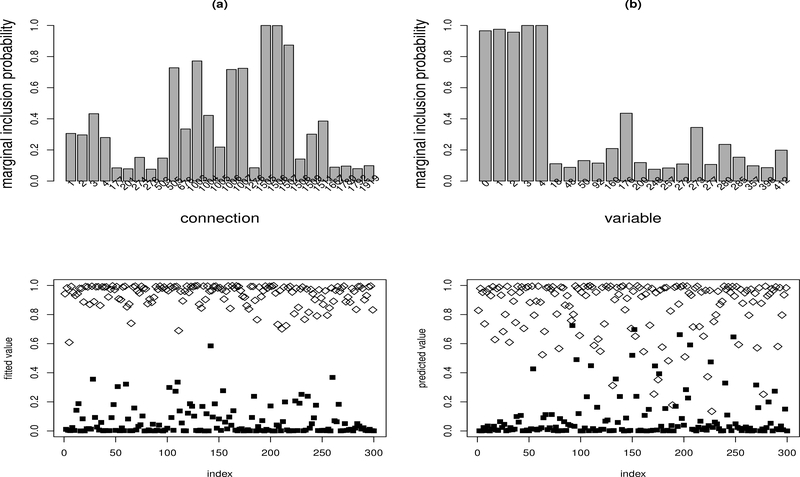
Figure 5:
Nonlinear classification example: (a) marginal inclusion probabilities of the connections with the marginal inclusion probability greater than 0.075; (b) marginal inclusion probabilities of the covariates with the marginal inclusion probability greater than 0.075; (c) fitted value of Y (open diamond for true Y = 1, filled square for true Y = 0); and (d) predicted value of Y (open diamond for true Y = 1, filled square for true Y = 0).

