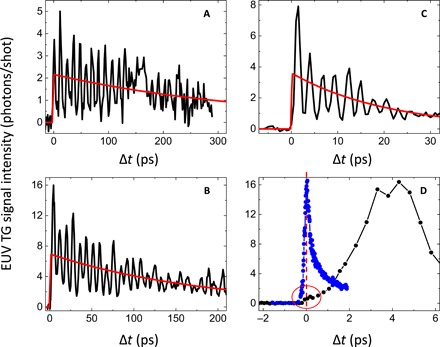
Fig. 2. EUV TG signal.

Black lines in (A), (B), and (C) are the EUV TG signals from Si3N4 membranes at LTG = 110, 85, and 28 nm, respectively, while the red line through the data is an exponential decay that accounts for the overall signal decay. (D) Comparison of the EUV TG signal at LTG = 85 nm, sampled with finer steps around the time zero region (black circles connected by lines), with the optically probed EUV TG signal (blue circles connected by lines; in this case, LTG = 280 nm and the sample is a 500-nm-thick Si3N4 membrane); the latter data are scaled to fit in the same scale, the vertical red dashed line indicates Δt = 0, while the red circle encloses the small bump observed at time zero in the EUV TG data.
