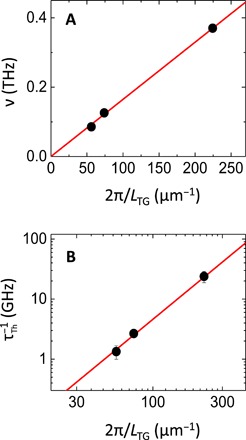
Fig. 3. Dispersion of EUV TG signal parameters.

Full dots are the dispersion relations of the frequency (A) and decay rate (B) as a function of the EUV TG wave vector (2π/LTG), as extracted from the data shown in Fig. 2. Red lines indicate the linear and quadratic trends of these two quantities.
