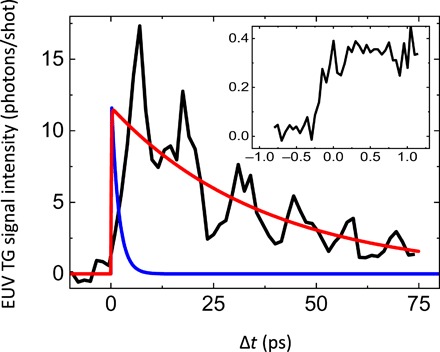
Fig. 4. EUV TG signal from Si.

The black line is the EUV TG signal from Si at LTG = 110 nm, the red line through the data is an exponential decay that accounts for the overall signal decay, while the blue line is the decay expected according to heat diffusion theory. The inset shows the region close to time zero sampled with finer Δt steps and larger accumulation time to reduce the noise level relative to that in the data shown in the main panel.
