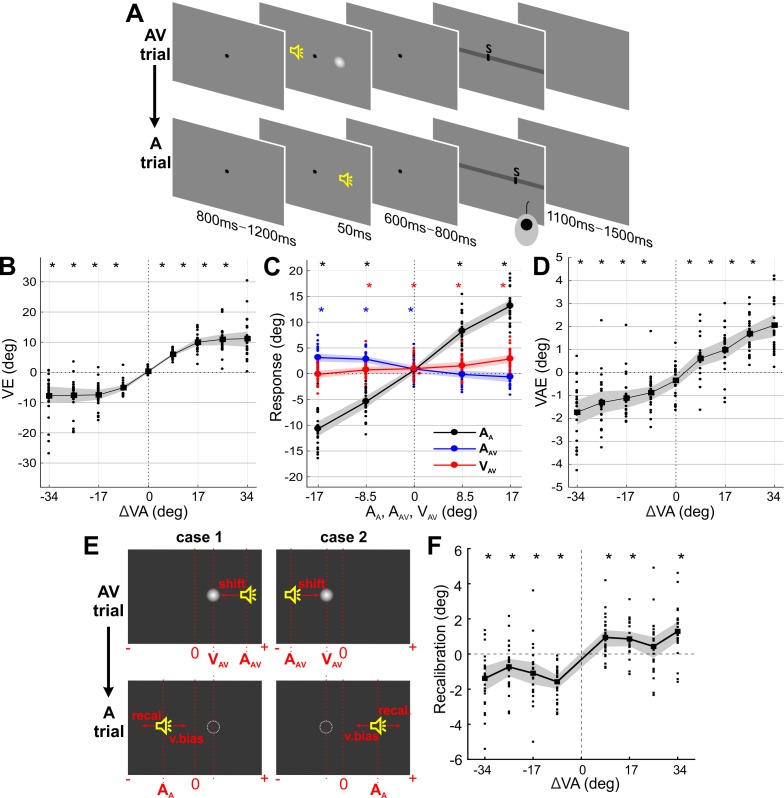
Figure 1. Paradigm and behavioral results (N = 24).
(A) Experimental design. Participants localized auditory (or visual) targets and indicated the perceived location using a mouse cursor. Audio-visual (AV) and auditory (A) trials alternated. (B) Response bias induced by the ventriloquist effect (VE) as a function of audio-visual discrepancy in the AV trial. VE: the difference between the reported location (RAV) and the location at which the sound (AAV) was actually presented (RAV - AAV). (C) Sound localization response in the A trial was significantly influenced by the current sound (AA; black), the previous sound (AAV; blue) and the previous visual (VAV; red) stimulus. (D) Response bias induced by the ventriloquist effect (VAE) as a function of audio-visual discrepancy in the AV trial. VAE: the difference between the reported location (RA) minus the mean reported location for all trials of the same stimulus position (RA – mean(RA)). (E) Example trials dissociating a pure visual bias from a genuine multisensory bias in the VAE. Trials for which the expected visual (v.bias) and multisensory (recal) biases are in opposite directions were selected; these satisfied either case 1: VAV - AAV < 0 and AA ≤VAV or case 2; VAV - AAV > 0 and AA ≥VAV. (F) Recalibration bias for trials from (E). Solid lines indicate mean across participants. Shaded area is the estimated 95% confidence interval based on the bootstrap hybrid method. Dots denote individual participants. Asterisks denote p-values<0.05 from two-sided Wilcoxon signed rank tests, corrected with the Holm method for multiple comparisons, AA: sound location in A trial. AAV: sound location in AV trial. VAV: visual location in AV trial. Deposited data: Data_behav (folder).

