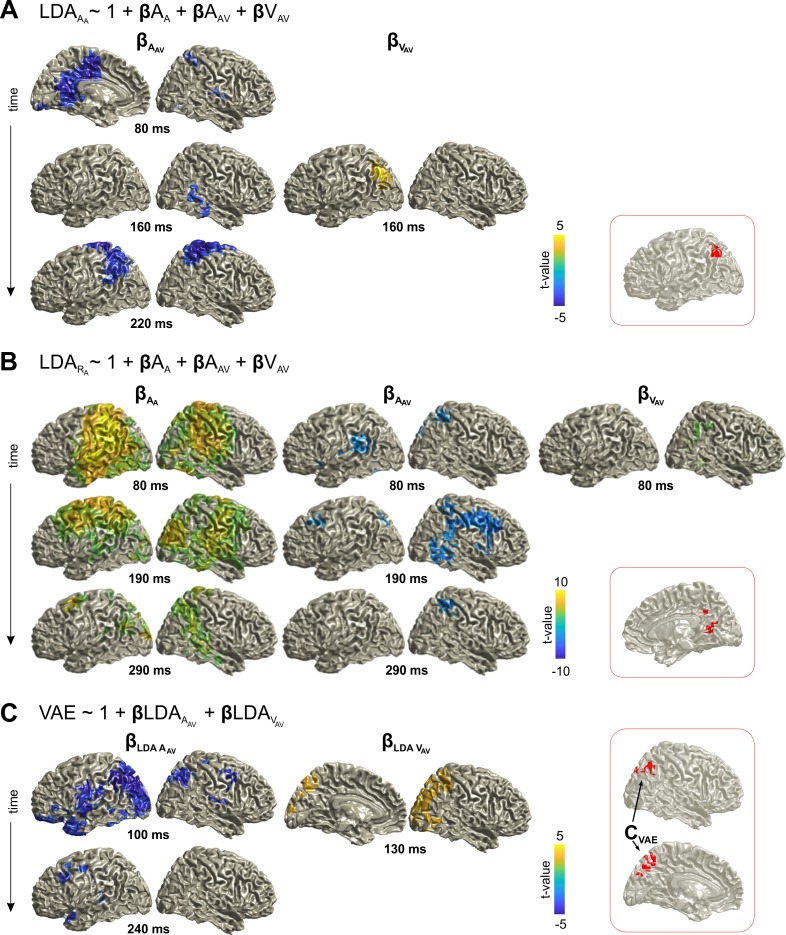
Figure 3. Neural correlates of trial-by-trial recalibration (VAE bias).
(A) Contribution of previous stimuli to the neural representation of the sound (AA) in the A trial (here the effect for AA itself is not shown). (B) Contribution of current and previous stimuli to the neural representation of the response (RA) in the A trial. (C) Ventriloquist–aftereffect in the A trial predicted by the neural representation of information about previous stimuli. Red insets: Grid points with overlapping significant effects for both AAV and VAV (A, B), and for both LDAA_AV and LDAV_AV (C) across time. Surface projections were obtained from whole-brain statistical maps (at p≤0.05, FWE corrected). See Table 1 for detailed coordinates and statistical results. AA: sound location in A trial. AAV: sound location in AV trial. VAV: visual location in AV trial. Deposited data: Atrial_LDA_AUC.mat; Atrial_LDA_beta.mat; VAE_beta.mat.

