. 2019 Jun 27;8:e47001. doi: 10.7554/eLife.47001

Figure 4. Neural correlates of audio-visual integration within a trial (VE bias).

Contribution of the representations of acoustic and visual information to the single trial bias in the AV trial. Red inset: Grid points with overlapping significant effects for both LDAA_AV and LDAV_AV. Surface projections were obtained from whole-brain statistical maps (at p≤0.05, FWE corrected). See Table 2 for detailed coordinates and statistical results. AAV: sound location in AV trial. VAV: visual location in AV trial. Deposited data: AVtrial_LDA_AUC.mat; VE_beta.mat.

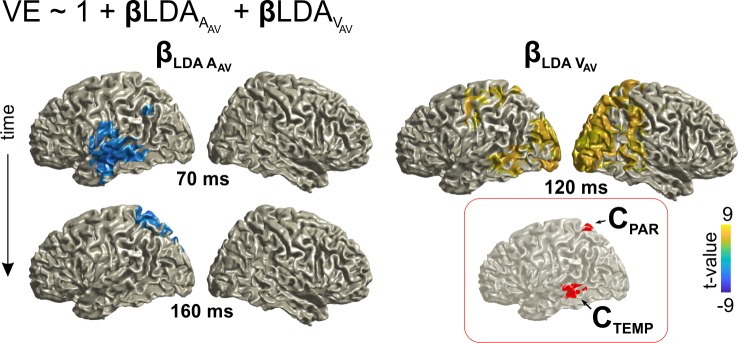
Figure 4.

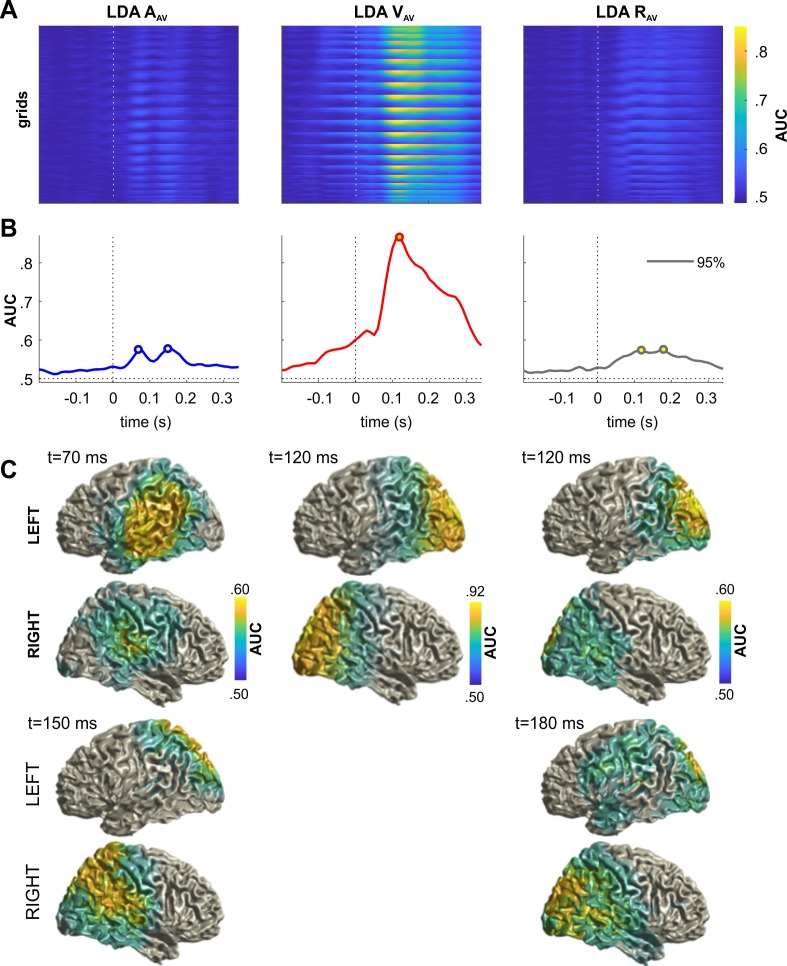
Figure 4—figure supplement 1. Neural representation of sensory information in AV trials.

Figure 4—figure supplement 1.

The figure shows the performances (AUC) of linear discriminants for variables of interest, applied to the MEG data from the AV trial. (A) Time-courses of discriminant performance for all points in source space. (B) Time-courses of the 95th percentile across source locations. (C) Surface projections of significant (p≤0.01; FWE corrected across multiple tests using cluster-based permutation) performance at the peak times extracted from panel B (open circles). Classification performance peaked around 70 ms and 150 ms for sound location (AAV), around 120 ms for visual location (VAV), and around 120 ms and 180 ms for the response (RAV). Deposited data: AVtrial_LDA_AUC.mat.