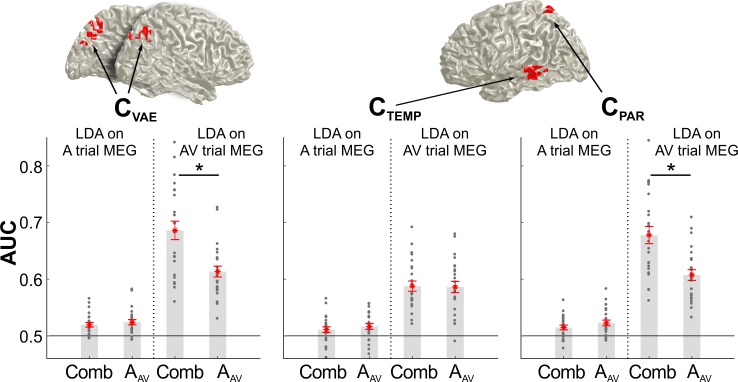
Figure 5. Classification performance for unisensory and combined multisensory information.
The bar graphs show the classification performance for each cluster of interest (CVAE from Figure 3C, CPAR and CTEMP from Figure 4) based on the activity in the AV trial or the A trial. Classification was applied to either the sound location in the AV trial (AAV), or the combined multisensory information in the AV trial (Comb), derived from the participant specific VE bias (derived from model mi3;VE ~ 1 + β⋅AAV + β⋅VAV for the behavioral data). Asterisks denote p<0.01, two-sided paired t-test, FDR corrected for multiple comparisons at p≤0.05. Gray dots are individual participant values averaged within each cluster, red stars are the mean across participants, and red lines are standard errors of mean. AAV: sound location in AV trial. VAV: visual location in AV trial. Deposited data: LDA_AUC_comb.mat.

