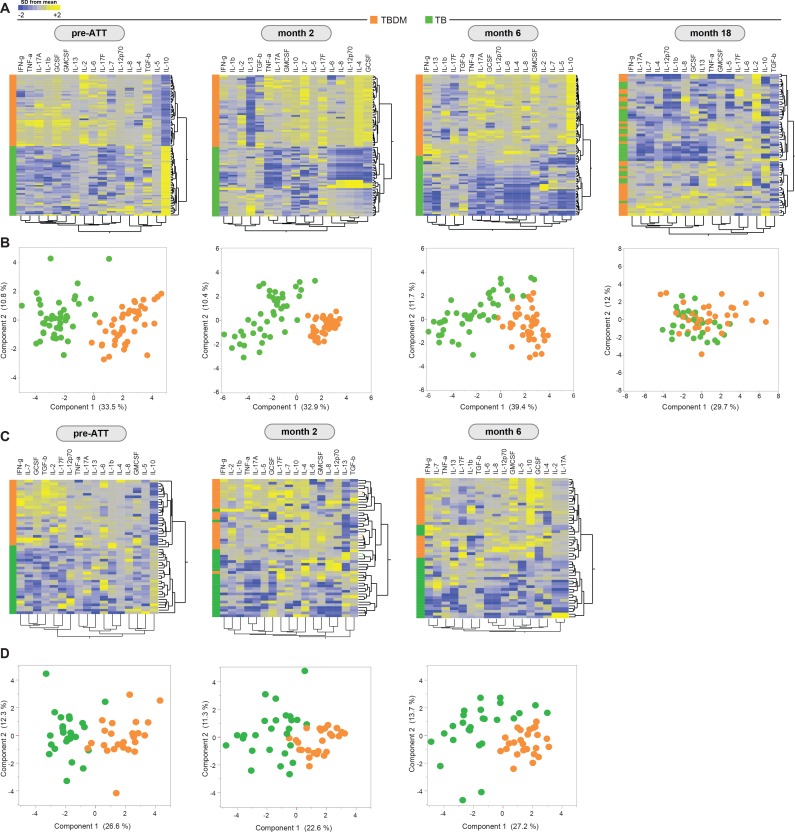
Figure 2. Prospective assessment of plasma biomarkers in pulmonary TB patients with or without concurrent diabetes undergoing anti-TB treatment.
Hierarchical cluster analysis (Ward’s method with 100x bootstrap) of z-score normalized, log-transformed values for each plasma analyte from the Indian and Brazil cohorts (A and C, respectively) at the indicated timepoints of antimicrobial treatment for drug-sensitive pulmonary TB. In the heatmaps, yellow color represents the highest values whereas blue color indicates the lowest values measured for each analyte. Principal component analysis was performed to show the distribution of data from the India cohort and Brazil cohorts (B and D, respectively) on simultaneous assessment of variables shown in the heatmaps.

