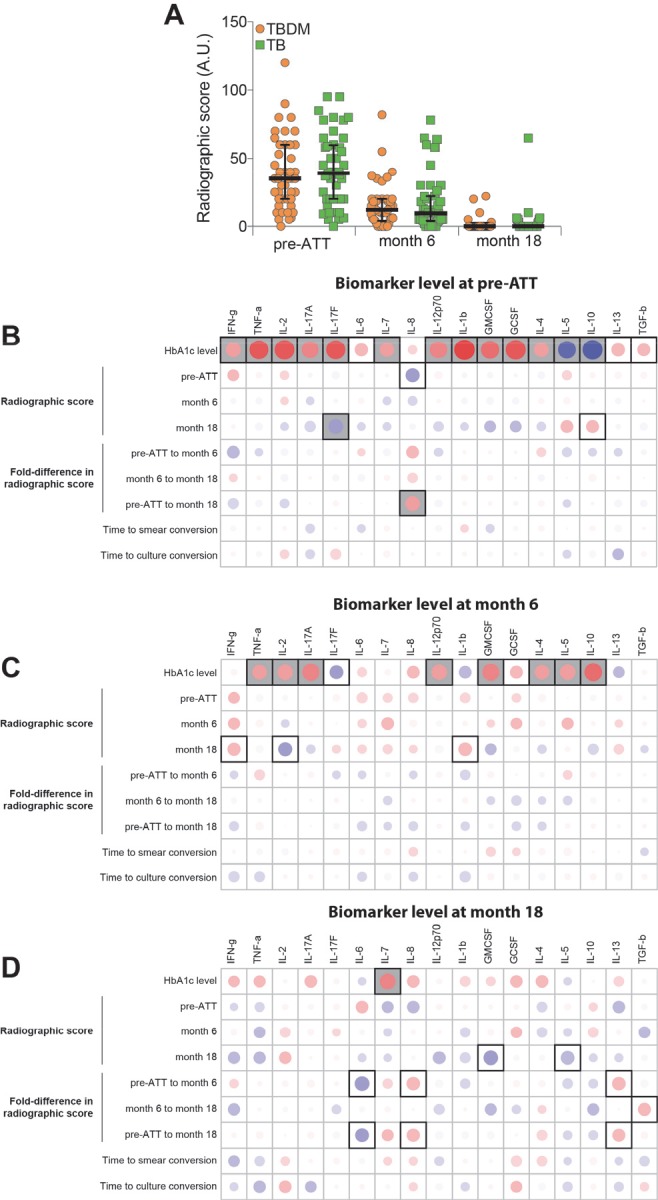
Figure 6. Associations between radiographic scores, HbA1c, and systemic inflammatory profiles in the India cohort.

(A) Change in radiographic score values before and at the indicated timepoints after the initiation of antimicrobial treatment for pulmonary TB. Dots represent individual participant values and horizontal lines indicate median values. Values were compared between TBDM and normoglycemic TB groups using the Mann-Whitney U test. (B–D). Spearman correlation matrices were built to examine associations between absolute radiographic score values or difference in score values between the indicated timepoints (fold-variation) and the indicated plasma analyte value at each study timepoint. The Spearman rank values are shown in a heatmap scale. Statistically significant correlations (p<0.05) are highlighted in bold squares. Gray squares indicate significant correlations after adjusting for false discovery rate (FDR 1%). Red dots represent positive correlations while blue dots represent negative correlations.
