. 2019 May 29;8:e46181. doi: 10.7554/eLife.46181

Figure 2. Using translational enhancers to increase the signal from destabilized fluorescent reporters for in vivo study.

(a) Illustration of the regular and destabilized GFP reporters. All the GFPs used in this study are the fast folding superfolder GFP (sfGFP). Destabilized GFP is labeled as dGFP, and dGFP reporter with translational enhancing elements is labeled as edGFP. All FPs used in this study contain the SV40 nuclear localization signal (NLS) at the N-terminus to facilitate signal segregation unless specified otherwise. (b, c) Comparison of dGFP and edGFP controlled by 6XSTAT response element in fly embryos and Su(H)Gbe Notch responding element in third instar wing imaginal discs. Images were taken with identical exposure. The contour of the embryo is outlined. (d) Dissected fly wing disc, expressing the STAT::edGFP and STAT:: eRFP, cultured ex vivo. Tissue was treated with 10 μM Actinomycin D to block transcription. STAT at the hinge region of the wing disc was imaged every 5 min for 4.5 hr. (e) The intensities of both dGFP and RFP were measured over time. Data from three independent replicates were collected and plotted. (f) The in vivo reporter half-life (TGFP1/2, representing effects of both Tm1/2 and Tp1/2) was estimated by linear regression of fluorescent intensity (in logarithmic scale). 95% confidence interval was calculated from linear regression. (g) Regular GFP and dGFP are expressed under Su(H)Gbe together with translational enhancers. Images were taken under identical parameters. The total fluorescent intensity from both reporters was plotted below with the intensity normalized to the dGFP signal. Data were collected from 10 different brains for each genotype. Scale bar: (b) 50 μm; (c, g) 100 μm; (d) 25 μm. Error bar: s.e.m.

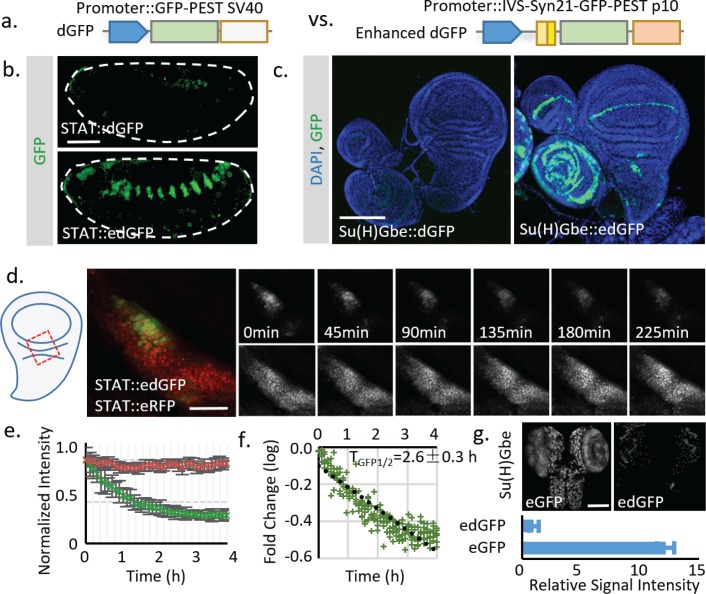
Figure 2—source data 1. Source data for Figure 2e,f.
DOI: 10.7554/eLife.46181.010
Figure 2—source data 2. Source data for Figure 2g.
DOI: 10.7554/eLife.46181.011

Figure 2.

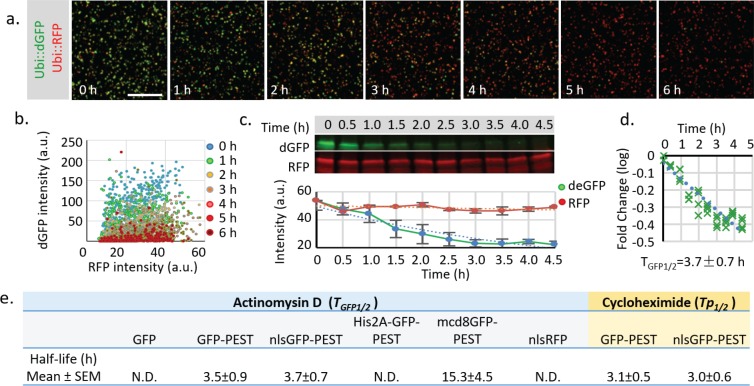
Figure 2—figure supplement 1. Measurement of the half-life of destabilized GFP in cultured Drosophila S2 cells.

Figure 2—figure supplement 1.

(aDrosophila S2 cells transiently transfected with both Ubi::nls-sfGFP-Myc-PEST and Ubi::nls-RFP-HA were treated with 10 μM Actinomycin D to block RNA synthesis for 6 hr. Images with identical exposure time were taken every hour after drug addiction. Scale bar: 100 μm. (b) The plot of fluorescence intensity of dGFP and RFP in cultured cells at different time points. (c) S2 cells treated with the transcriptional blocker Actinomycin D were harvested every 0.5 hr from time 0.0 hr to time 4.5 hr. Samples were analyzed by fluorescent western blot using rabbit anti-Myc (800 nm, Green) and mouse anti-HA (700 nm, Red). Quantification of fluorescent intensity from three independent experiments. Error bar: s.e.m. (d) Fold change of fluorescent intensity was plotted over time (logarithmic scale). The combined half-life of both mRNA and protein (TGFP1/2) was calculated by linear regression using least squares estimation. The expected value and 95% confident interval of TGFP1/2 was calculated from the linear regression. (e) Table of measured half-lives of fluorescent reporters (TGFP1/2, including both mRNA and protein half-life) measured using western blot after Actinomycin D treatment (in blue cells). Protein half-life (Tp1/2) was measured using western blot after cycloheximide (100 μg/ml) treatment to block protein synthesis (in yellow cells). Regular GFP, RFP or GFP-PEST fused with His2A is too stable to be reliably estimated within the 5 hr treatment period.
Figure 2—figure supplement 1—source data 1. Source data for Figure 2—figure supplement 1b.
DOI: 10.7554/eLife.46181.007
Figure 2—figure supplement 1—source data 2. Source data for Figure 2—figure supplement 1c.
DOI: 10.7554/eLife.46181.008
Figure 2—figure supplement 1—source data 3. Source data for Figure 2—figure supplement 1d.
DOI: 10.7554/eLife.46181.009