. 2019 May 29;8:e46181. doi: 10.7554/eLife.46181

Figure 4. Dynamics of STAT and Notch activity revealed in fixed tissues.

(a) The destabilized GFP (dGFP) combined with stable RFP functions as a fluorescent timer to reveal transcriptional dynamics. The maturation and degradation half-lives of dGFP and RFP are indicated. (b. c) A comparison between the regular GFP reporter with a combination between dGFP and RFP reporter under control of either STAT response elements or Notch response element Su(H)Gbe. Both reporters are visualized in third instar larval brains. NB, neuroblast; GMC, Ganglion mother cells. Scale bar: (b, c) 50 μm.

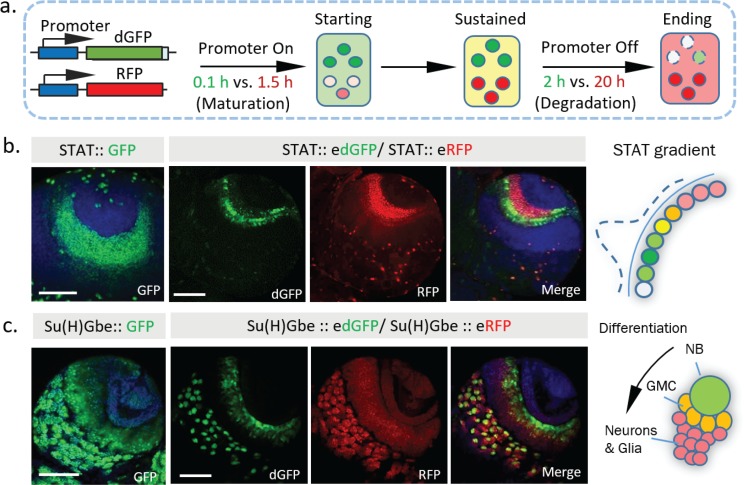
Figure 4.

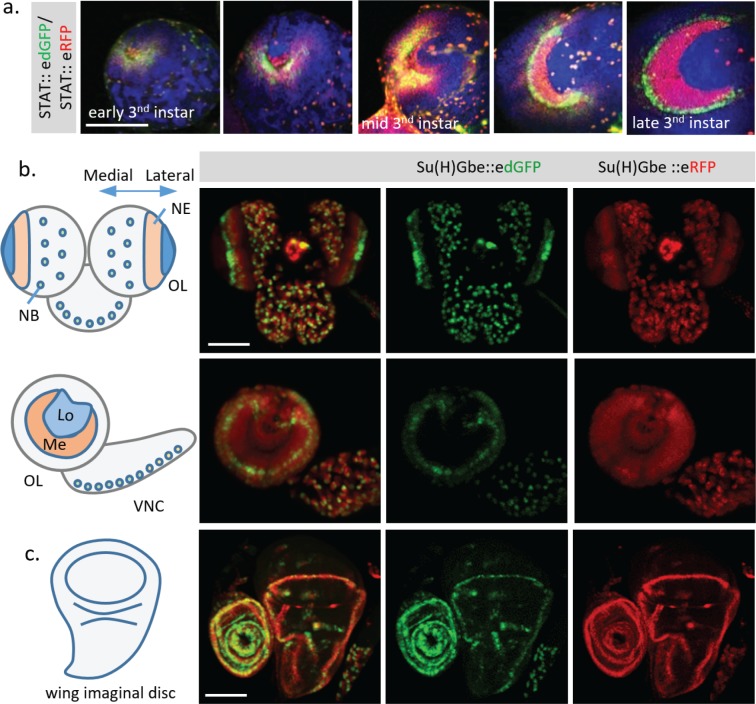
Figure 4—figure supplement 1. Additional dynamics of Notch and STAT activity revealed in different fixed tissues and stages.

Figure 4—figure supplement 1.

(a) Change of STAT activity in third instar larval optic lobe (OL) at different developing stages. (b) Activities of Notch signaling revealed by Su(H)Gbe::edGFP and Su(H)Gbe::eRFP in third instar larval brain. In the optic lobe (OL), the Notch signal is down-regulated by a ‘proneural wave’ that sweeps across the neuroepithelium (NE) from the medial to the lateral regions, to trigger the NE to neuroblast (NB) transition. Consistent with this, a gradient change of Notch activity from red to green was observed in the NE region. Red signal (Notch low) located medially, and a band of green signal (Notch high) located at the lateral side of the OL, were observed, revealing the site of Notch pathway activation and progression of the proneural wave. Lo, lobula; Me, medulla; VNC, ventral nerve cord. (c) Both dGFP and RFP reporters show activity in the wing margin region of the third instar wing disc, with the GFP signal concentrated in a more defined cell population. Scale bar: (a,b,c) 100 μm.
Figure 4—figure supplement 2. Live imaging of Notch activity in dividing Type I neuroblasts (NBs) in larval brain.

Figure 4—figure supplement 2.

(a) Notch activity is monitored by both Su(H)Gbe::edGFP and Su(H)Gbe::eRFP reporters. Dissected third instar larval brain was cultured together with the larval fat body in Schneider's medium and imaged every 5 min. A z-stack covering the entire NB cell body was taken. In the central brain region, the large neuroblasts (NBs) (green) undergo asymmetric cell division and create new NBs and much smaller progeny cells (red). (b) The total signal from a single NB was measured using Bitplane Imaris software. The dGFP channel showed an oscillation with amplitude ~8% of the average signal, whereas the RFP channel is generally flat. The change of dGFP is consistent with an asymmetric NB cell division event (~1.5 hr) that produces a small progeny cell marked by RFP, suggesting that Notch activity may be affected during cell division. Scale bar: 25 μm.
Figure 4—figure supplement 2—source data 1. Source data for Figure 4—figure supplement 2b.
DOI: 10.7554/eLife.46181.022
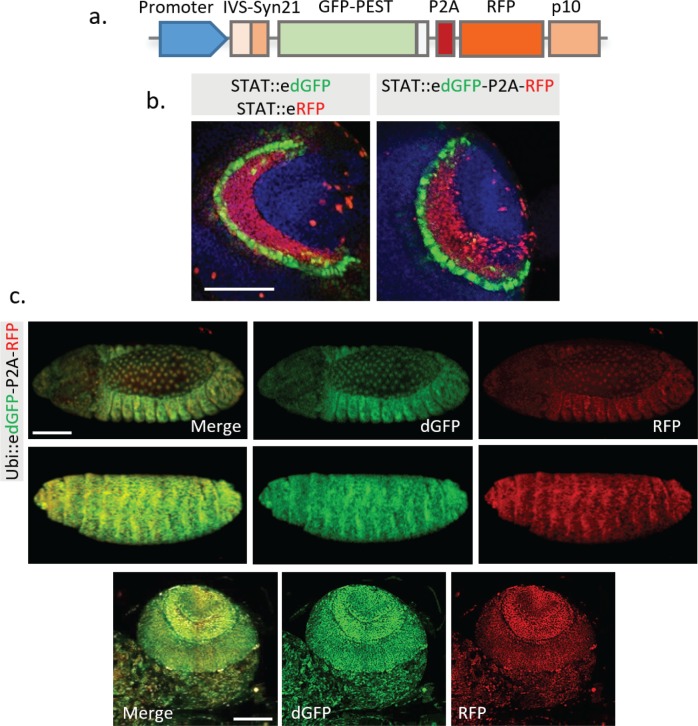
Figure 4—figure supplement 3. Combination of edGFP and RFP into a single construct using 2A peptide.

Figure 4—figure supplement 3.

(a) Structure of the multicistronic reporter containing edGFP and RFP. (b) Comparison between STAT::edGFP, STAT::eRFP and STAT::edGFP-P2A-RFP in third instar larval brain. (c) No significant change of ratio between dGFP compared to RFP was observed in the embryo and larval brain when both proteins are controlled by a constitutively active Ubiquitin promoter. Representative images from the stage 14 (top panel) and 16 (middle panel) fly embryos, and third instar larval optic lobe (bottom panel) are shown. Scale bar: (b) 50 μm; (c) 100 μm.