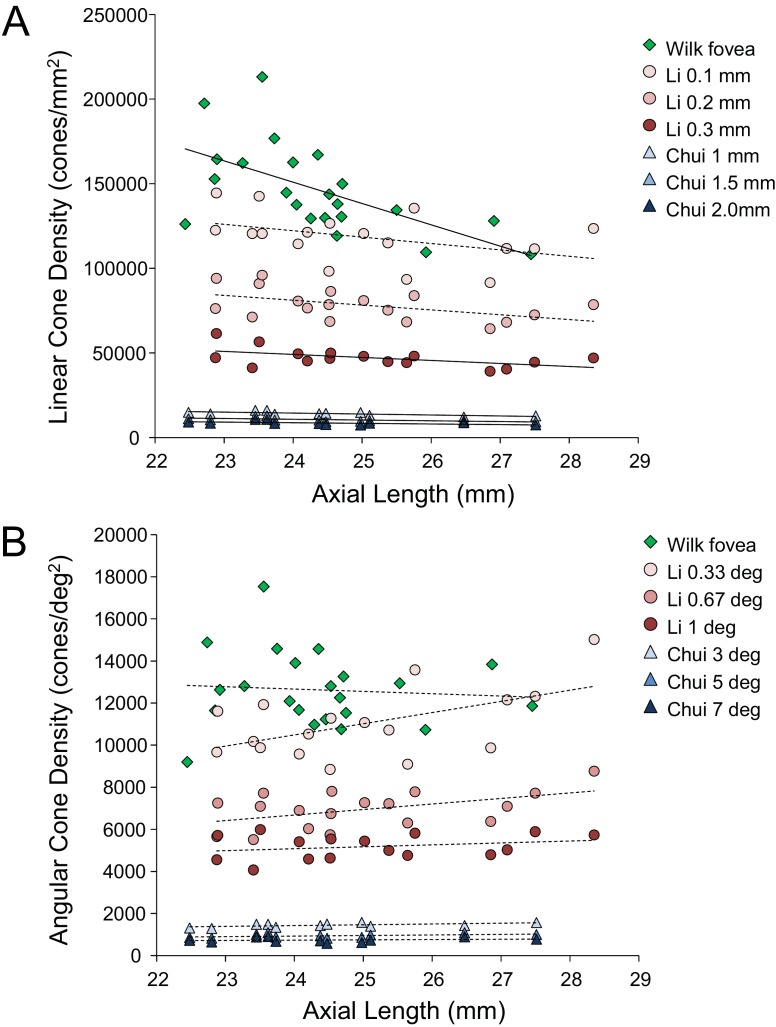
Figure 2. Summary of published data from Li et al. (2010), Chui et al. (2008) and Wilk et al. (2017).
In both plots, the linear fits with the solid lines indicate the data that have significant trends. (A) Linear cone density has a decreasing trend with axial length near the fovea. (B) Angular cone density (sampling resolution) of the eye generally increases with axial length although none of the data show a significant linear relationship.

