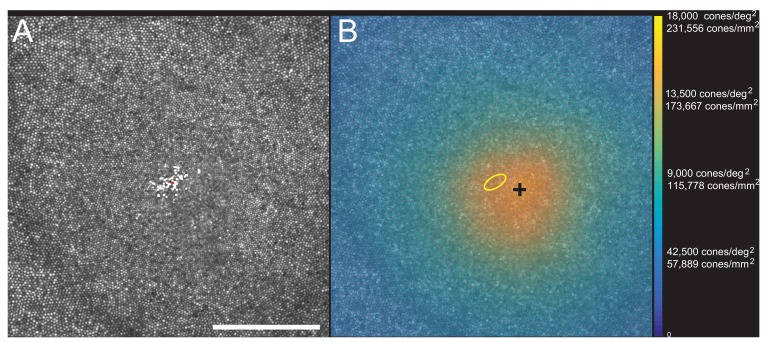
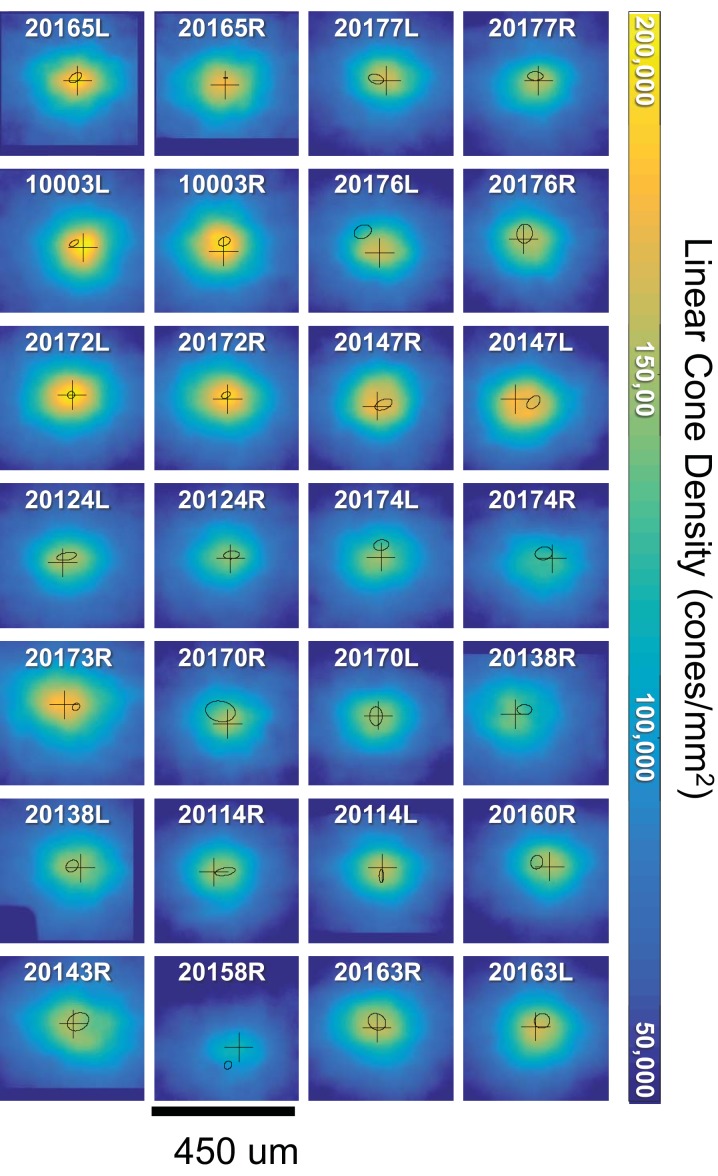
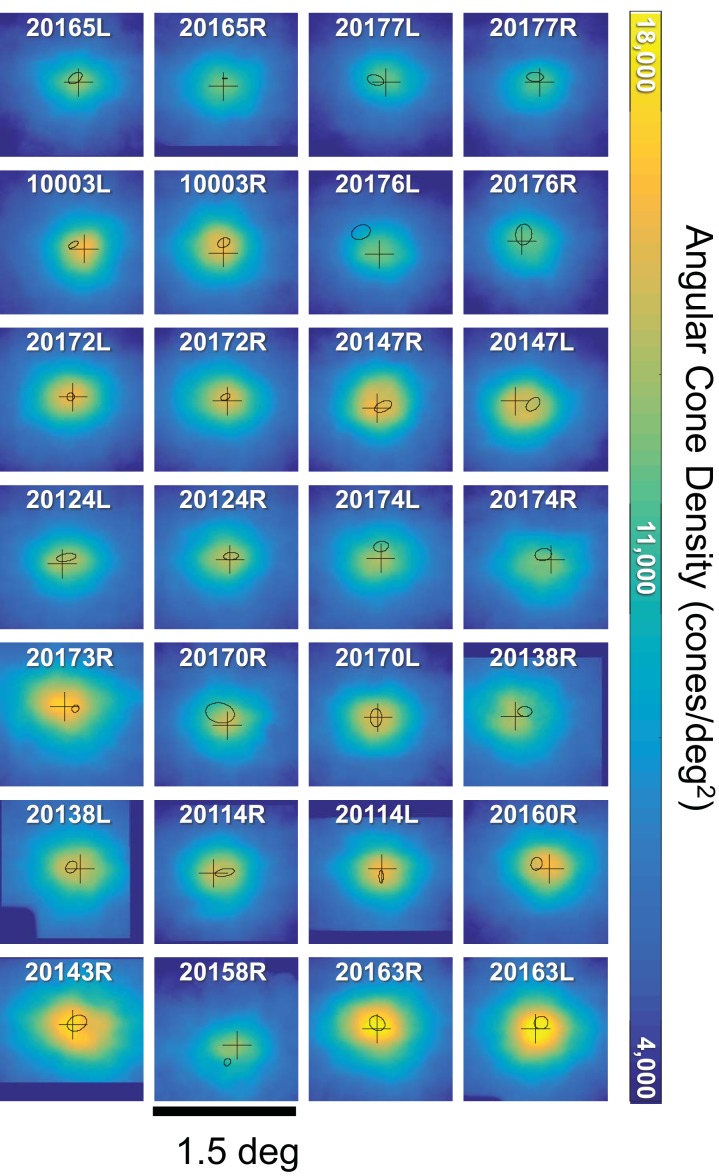
Figure 3. Image, PRL, cone locations and density plot for one subject.
(A) AOSLO image of the fovea of subject 10003L. Only the central 1.5 degrees are shown here (810 × 810 pixels), which contains 16,184 cones. The white dots are a scatter plot showing the PRL, or position of the fixated stimulus over the course of a 10 s video. The red dot is the centroid of the scatter plot. (B) Same image with a color overlay indicating the density. Linear and angular cone densities are indicated on the right colorbar. Peak cone densities in this eye are 204,020 cones/mm2 and 15,851 cones/deg2. The yellow ellipse is the best fitting ellipse containing ~68% of the points in the scatterplot and indicates the PRL. The black cross indicates the position of peak cone density. Scale bar is 0.5 degrees, which in this eye corresponds to 139.4 microns.


