. 2019 Jul 26;8:e47148. doi: 10.7554/eLife.47148

Figure 4. Cone density as a function of eccentricity for all eyes.

The axial length ranges of the subjects are color coded, with warmer colors for shorter eyes and cooler colors for longer eyes. In this plot, it is apparent that shorter eyes generally have higher peak cone densities.

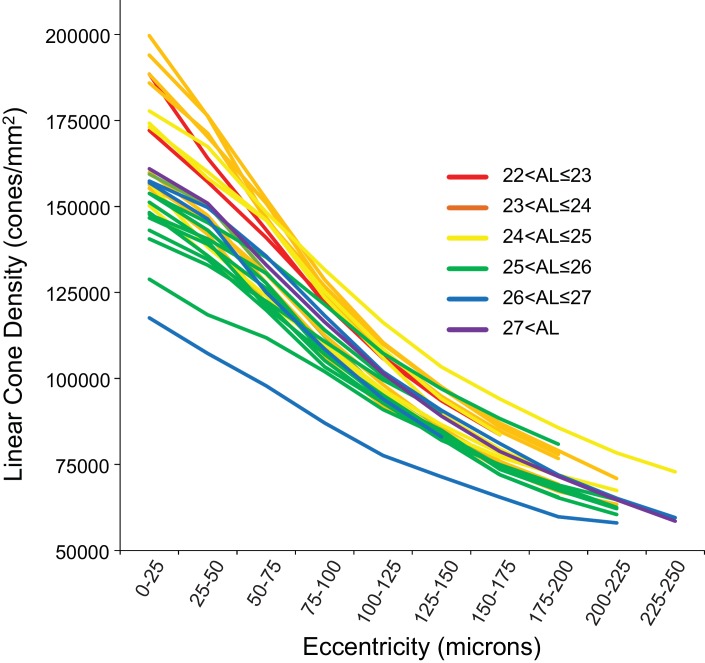
Figure 4—source data 1. Data for plots of cone density as a function of eccentricity for all subjects.
DOI: 10.7554/eLife.47148.015

Figure 4.

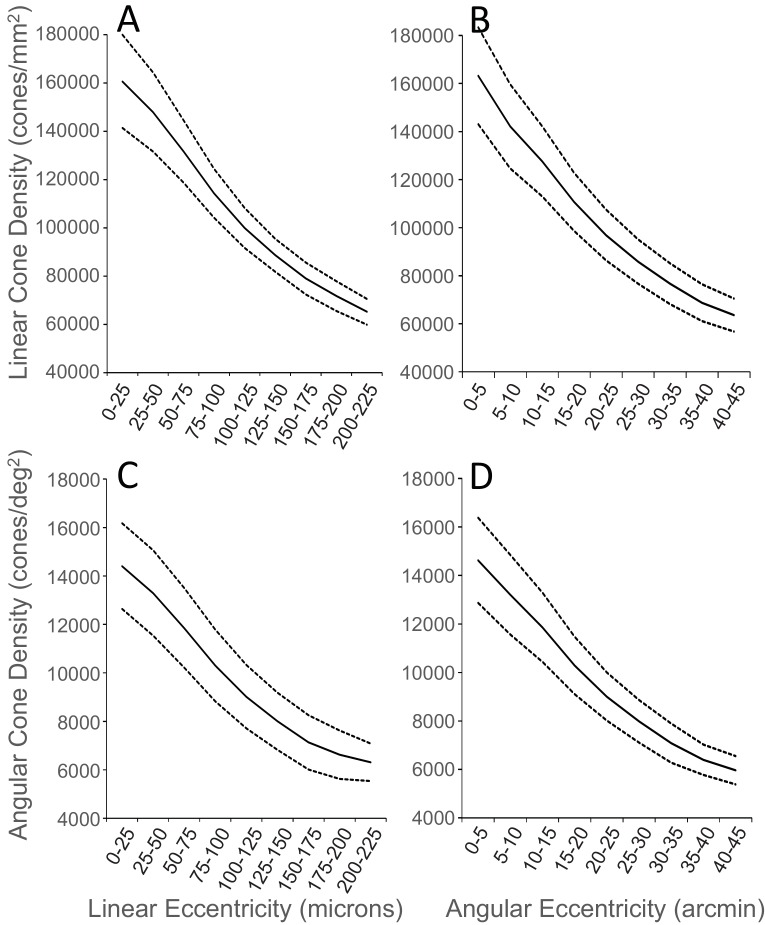
Figure 4—figure supplement 1. Plots of average cone density of all 28 eyes as a function of eccentricity in units of.

Figure 4—figure supplement 1.

(A) cones/mm2 vs. eccentricity in microns, (B) cones/mm2 vs. eccentricity in arcminutes (C) cones/deg2 vs. eccentricity in microns and (D) cones/deg2 vs. eccentricity in arcminutes. The solid lines are the average and the upper and lower dashed lines represent ±1 standard deviation from the average.
Figure 4—figure supplement 1—source data 1. Data for plots of average linear and angular cone density as a function of eccentricity.
DOI: 10.7554/eLife.47148.012
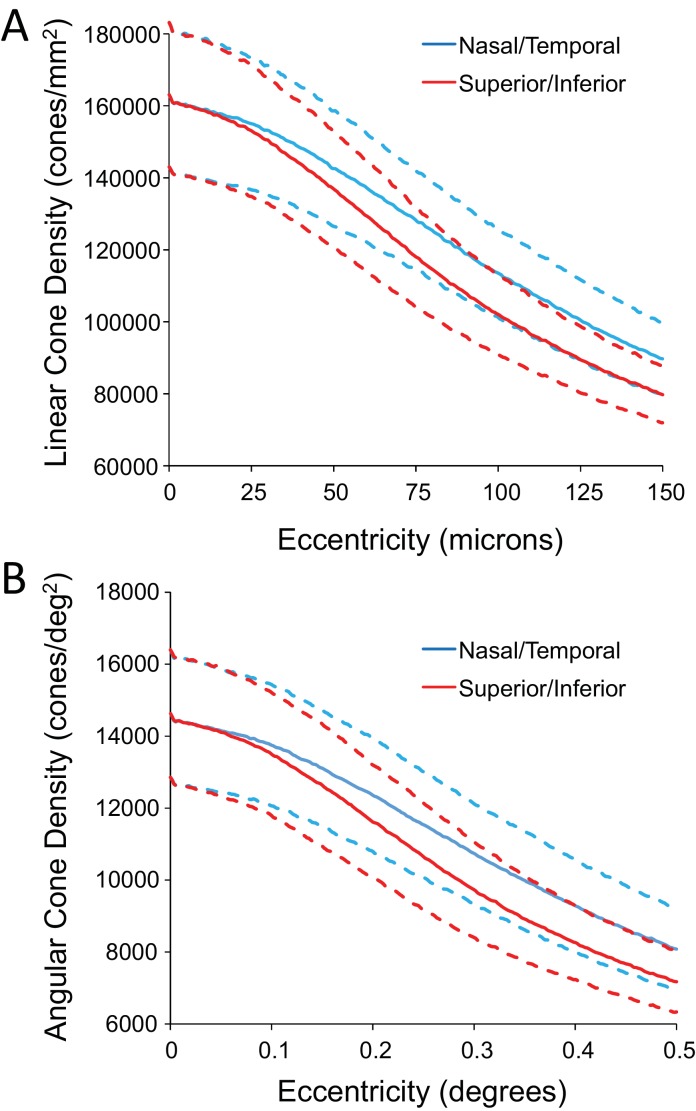
Figure 4—figure supplement 2. Plots of density as a function of eccentricity in the vertical and horizontal directions.

Figure 4—figure supplement 2.

(A) linear cone density (B) angular cone density. The dashed lines represent ±1 standard deviation from the mean.
Figure 4—figure supplement 2—source data 1. Data for plots of average linear and angular cone density as a function of eccentricity in the horizontal and vertical directions.
DOI: 10.7554/eLife.47148.014