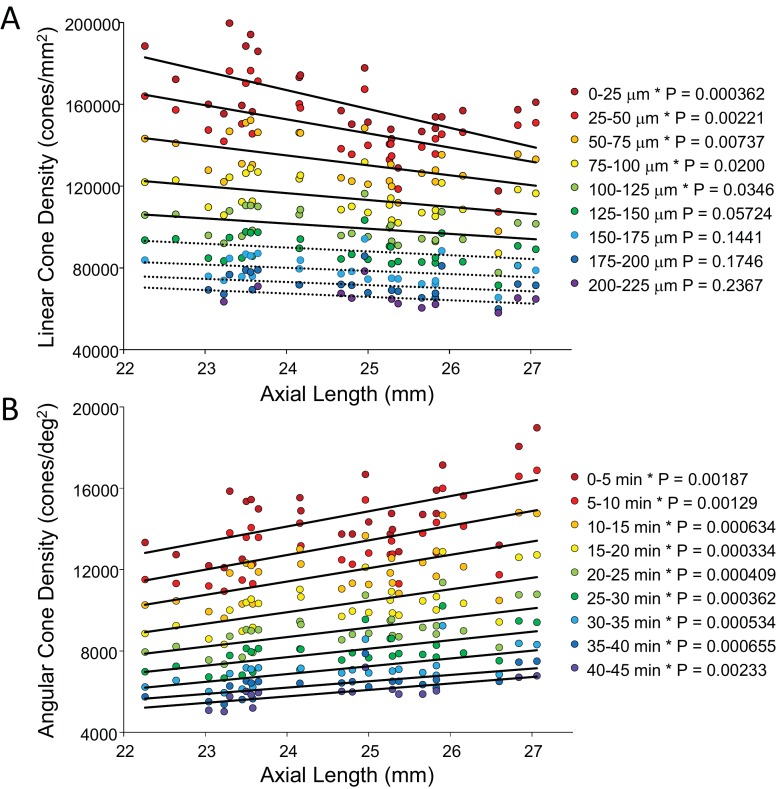
Figure 5. Plots of cone density as a function of axial length at and near the fovea.
(A) Linear cone densities as a function of axial length. Longer eyes have lower linear cone density than shorter eyes. The trend remains significant out to 100 microns eccentricity. At the peak, the details for the trendline are: slope = −3,185 with 95% confidence intervals from −4,578 to −13,793. (B) Angular cone densities as a function of axial length. The peak angular cone density increases significantly with increasing axial length and this trend remains significant out to 40 arcminutes eccentricity. At the peak, the details for the trendline are: slope = 749 with 95% confidence intervals from 304 to 1193. Relationships with p-values<0.05 are labeled with asterisks and trendlines are shown as solid lines. Relationships with p-values≥0.05 have dashed trendlines.

