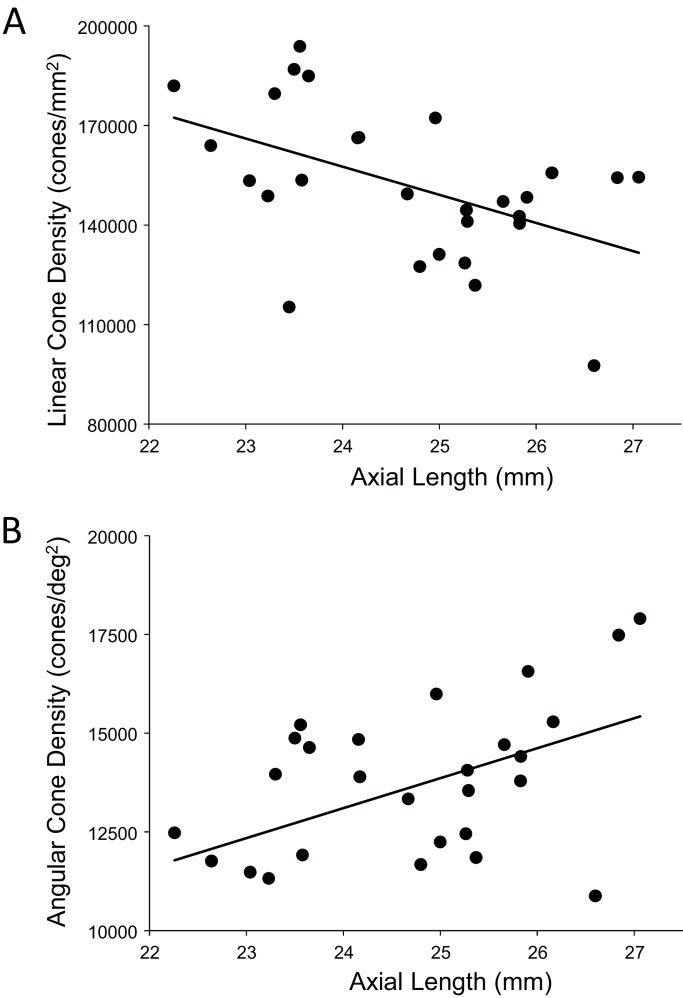
Figure 6. The relationship between cone density and axial length shows the same pattern at the PRL as for the peak cone density.
The numbers for the trendline in (A) are slope: 759; 95% CI: 198 to 1,320; p=0.00999. The numbers for the trendline in (B) are: slope = −8,490; 95% CI −14,600 to −2,420; p=0.00795). Axial length accounts for 24%% and 23% of the variance in linear and angular cone density, respectively.

