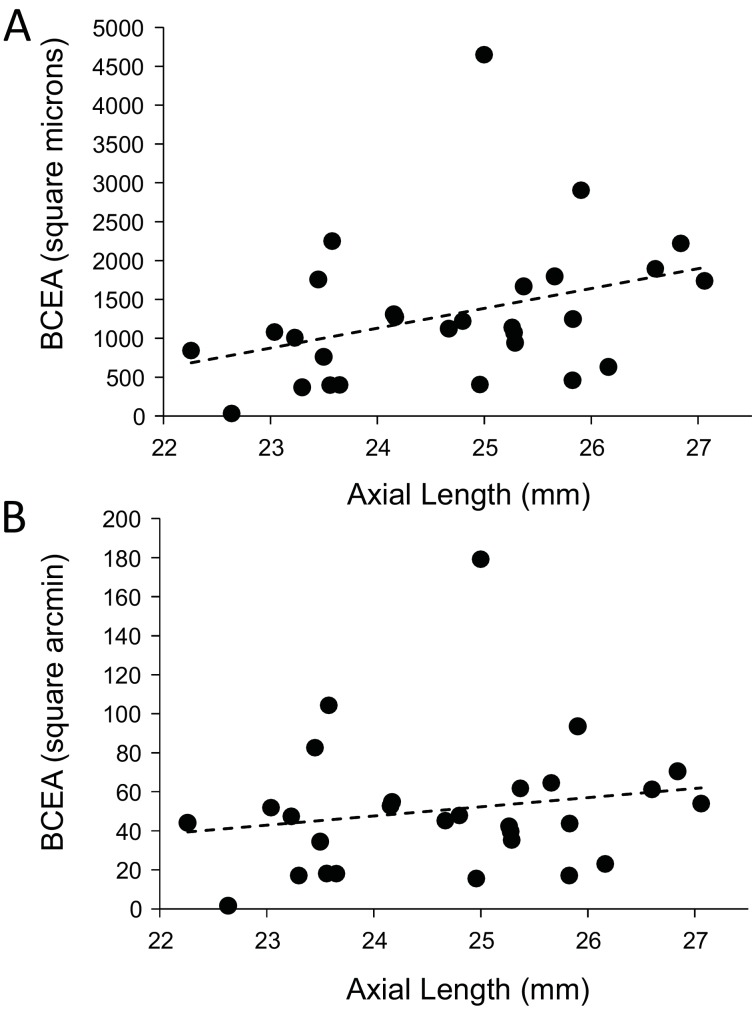
Figure 7. Plots of the magnitude of fixational eye movements as a function of axial length.
(A) The plot of BCEA in linear units (square microns) vs. axial length shows a trend that approaches significance (p=0.0596). (B) There is no significant relationship between BCEA in angular units (square arcminutes) and axial length (p=0.364).

