
Author response image 1. Plots of linear cone density at different retinal locations using retinal magnification factors computed using a formula from Bennett et.al., 1994.
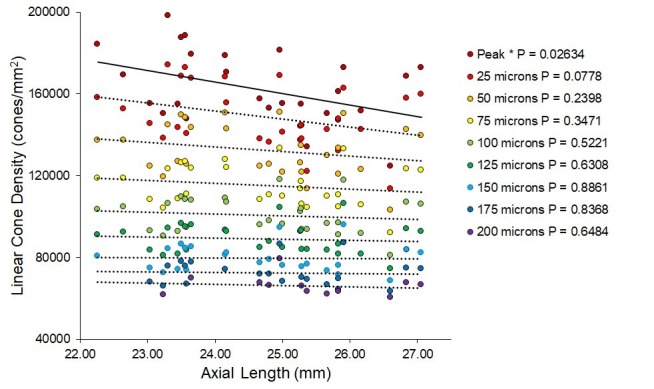
Even though the retinal image size for myopes is underestimated for myopes and overestimated for hyperopia, there is still a significant drop in density with increasing axial length at the location of peak density.