
Author response image 3. The right plot shows that the peak foveal cone density increases as the cone sampling window is decreased.
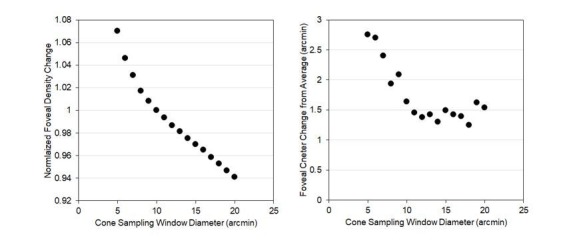
Note that the increase with reducing sampling window is linear until about 10 arcminutes. The left plot shows that the variability in the location of the peak foveal density remains consistent (within about 1.5 arcminutes of the mean) with cone sampling windows of 10 arcminutes or greater.