. 2019 Jul 26;8:e46454. doi: 10.7554/eLife.46454

Figure 2. Relationships among the Spok homologs.

(A) Schematic representation of the main features of the Spok genes. All homologs share an intron within the 5' UTR. At the start of the coding region (CDS) there is a repeat region, in which the number of repeats varies among the homologs. The central portion of the CDS has a number of indels, which appear to be independent deletions in each of Spok2, Spok3, and Spok4. There is a frameshift mutation at the 3' end of the CDS that shifts the stop codon of Spok3 and Spok4 into what is the 3' UTR of Spok1 and Spok2. The pseudogenized Spok gene (SpokΨ1) contains none of the aforementioned central indels and appears to share the stop codon of Spok1 and Spok2. However, there are numerous mutations that result in stop codons within the CDS as well as a full DNA transposon (discoglosse) insertion. No homologous sequence of the 5' end of SpokΨ1 is present. (B) A NeighborNet split network of all active Spok genes from all strains sequenced in this study. The four homologs cluster together well, but there are a number of reticulations, which presumably are the result of gene conversion events. (C) Maximum likelihood trees based on three separate regions of the Spok genes: the 5' UTR, the CDS, and the 3' UTR (starting from the stop codon of Spok3 and Spok4). The trees are rooted arbitrarily using Spok2. Branches are drawn proportional to the scale bar (substitutions per site), with bootstrap support values higher than 70 shown above.

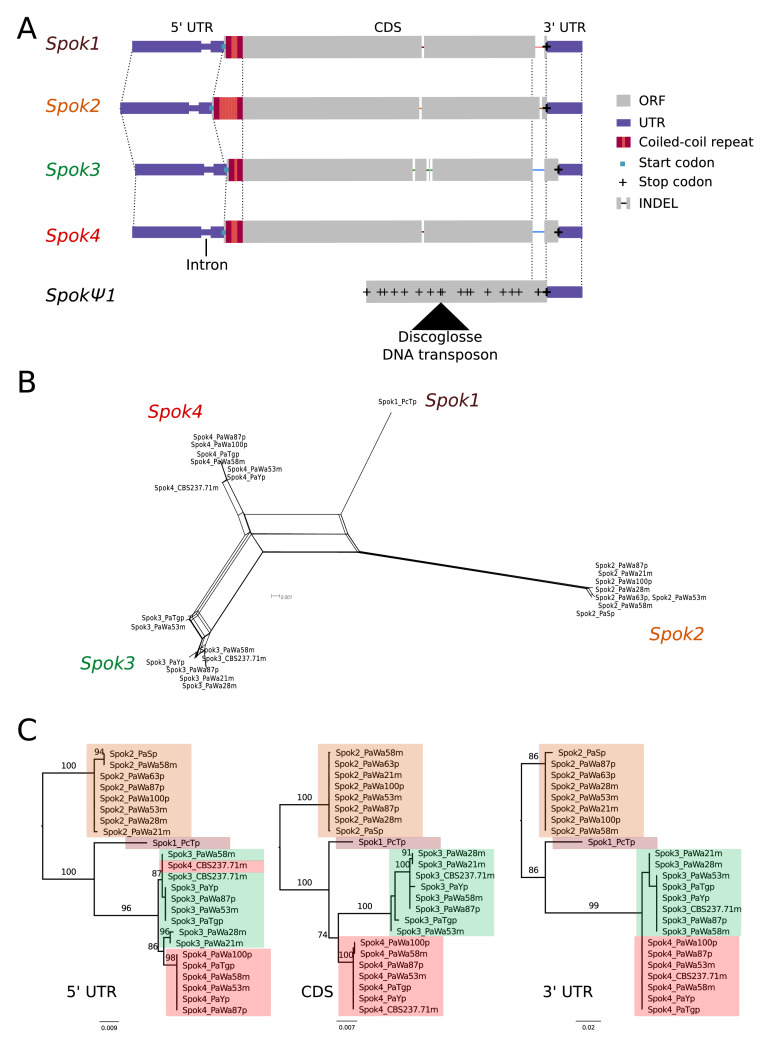
Figure 2.

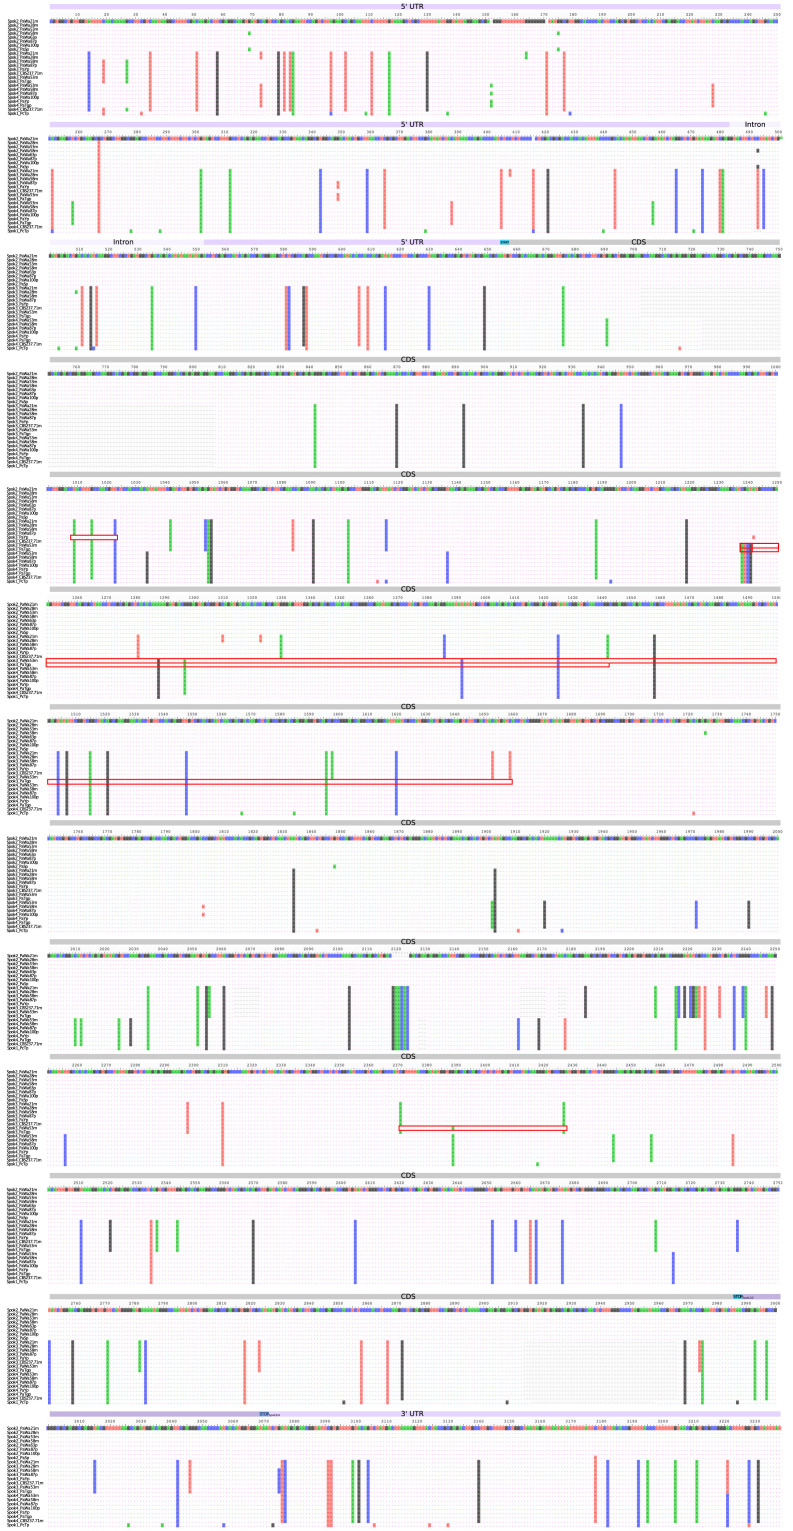
Figure 2—figure supplement 1. Nucleotide alignment of the Spok homologs from the strains sequenced with long-read technologies.

Figure 2—figure supplement 1.

The alignment includes the UTRs and intron. Start and stop codons are marked above the alignment track and the regions of putative gene conversion are encased in red boxes.
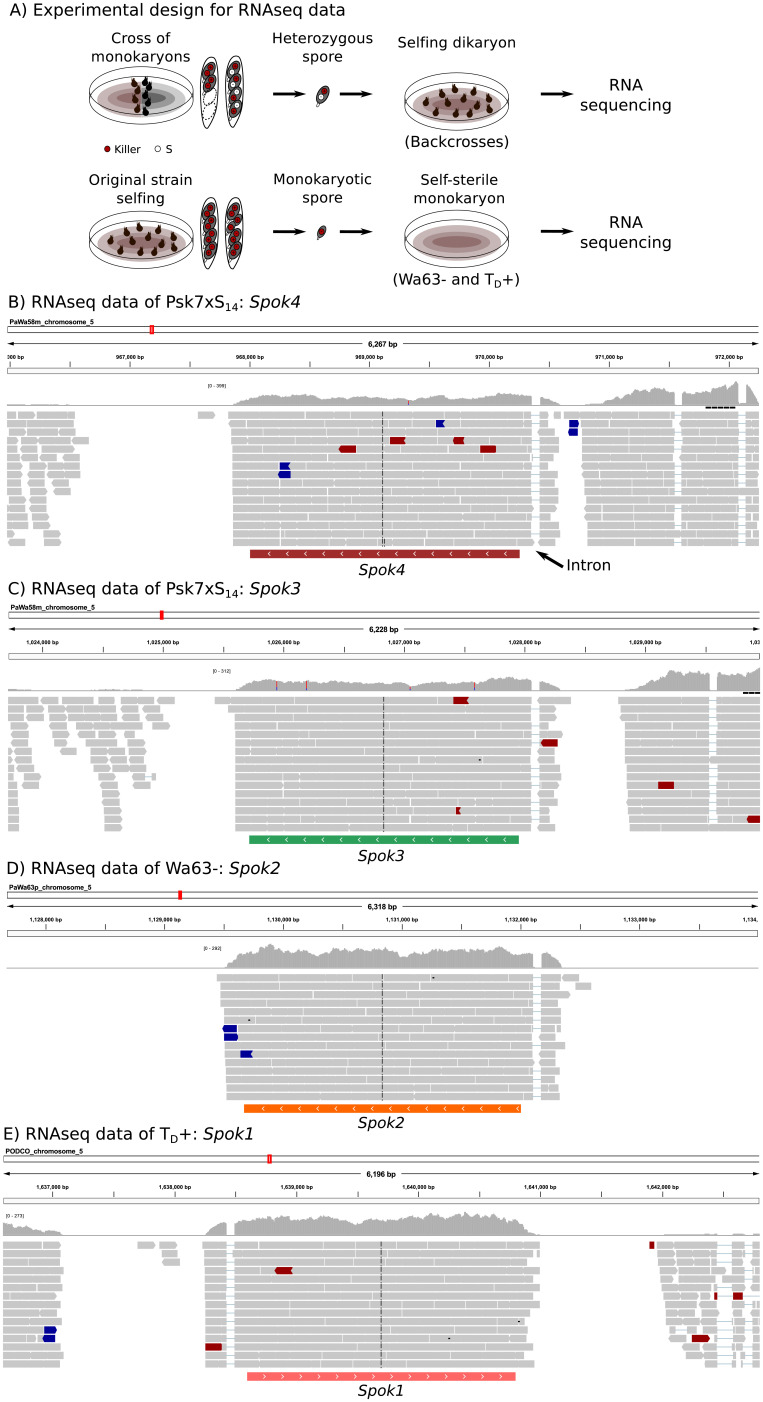
Figure 2—figure supplement 2. The expression of Spok genes based on RNAseq data.

Figure 2—figure supplement 2.

In order to ensure the expression of the killer elements, we extracted RNA from an isolated self-killing heterozygote spore, produced by mating the monokaryotic Psk S14 backcrosses to a monokaryon S of opposite mating type (top of (A)). RNAseq of monokaryotic (self-sterile) spores was also obtained (bottom of (A)). The RNAseq data of one self-killing culture (Psk7xS14 vs S) mapped to Wa58– (Psk-7) illustrates the expression of both Spok4 (B) and Spok3 (C). The expression of Spok2 (D) and Spok1 (E) in vegetative cells can be appreciated in the RNAseq data of Wa63– and TD+, respectively. In all cases, the predicted single exon of each Spok gene is shown below the reads, which in turn reveals an intron in the 5'UTR. Read colors follow the defaults in the genome browser IGV, with gray reads having typical expected insert size, and blue and red reads having slightly too small or too large insert sizes, respectively. The distributions above the reads correspond to the depth of coverage. Some sites appear to be polymorphic (blue and red bars in the depth distributions) due to low frequency mismapping of reads from other Spok homologs.