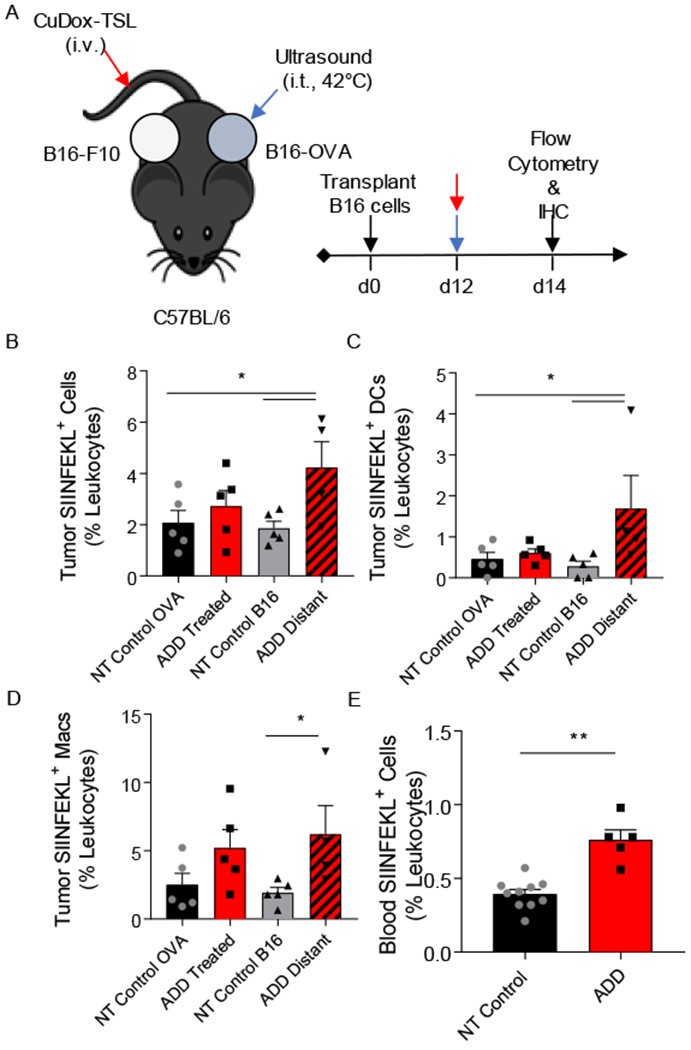
Figure 2. Tumor-specific antigen presentation increased in tumor and blood after treatment.

A) Schematic diagram illustrating the treatment protocol of CuDox+US (ADD) in C57BL/6 mice (n = 13) bearing one B16-OVA tumor (locally treated tumor) and one control B16-F10 tumor on the opposite side (distant tumor). B-D) Frequency of SIINFEKL-labeled immune cells, and specifically DCs, and macrophages as a percentage of leukocytes in tumors directly treated with ADD or in the distant tumor of the treated mice (n = 5) compared to B16-OVA and B16-F10 tumors of untreated control mice (n = 5), respectively. E) Frequency of SIINFEKL-labeled blood immune cells as a percentage of leukocytes in blood of mice treated with ADD compared to no-treatment (NT) control mice (n = 3). * p < 0.05, ** p< 0.01.
