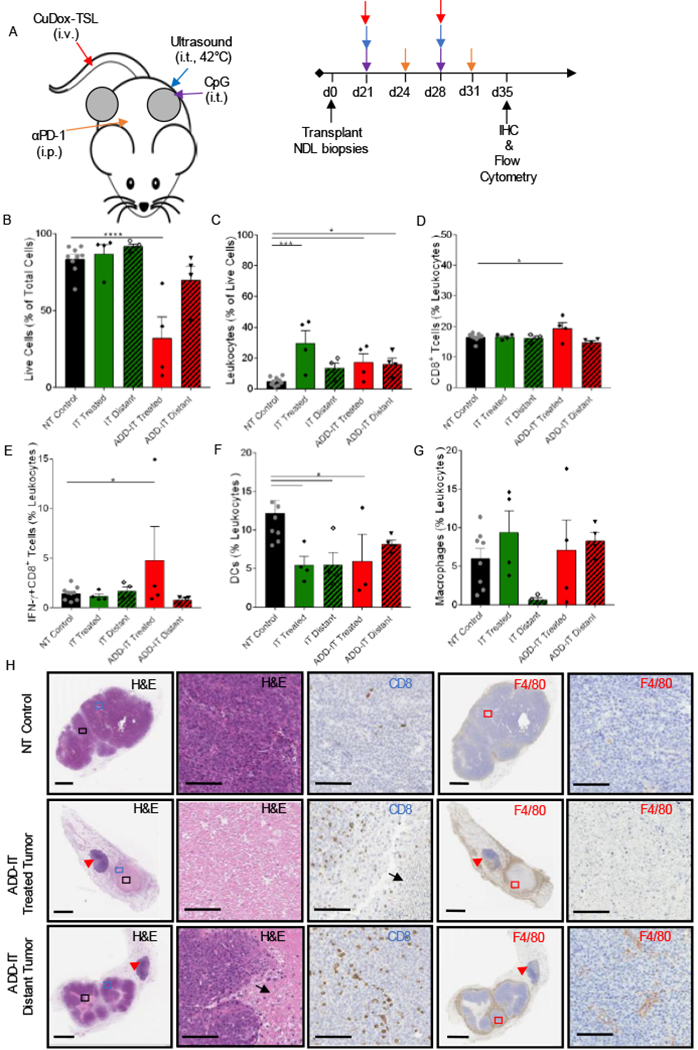
Figure 4. Two treatments of ADD-IT increased IFN-ɣ-producing T-cells in the treated NDL tumor.

A) Representative treatment protocol and timeline for two treatments of ADD-IT administered to NDL tumor-bearing mice. B-G) After two sequential treatments of CuDox+US+CpG+ αPD-1 (ADD-IT, n = 4), the entire inguinal fat pads containing tumor and lymph node were harvested from treated mice and stained for CD45, CD3, CD4, CD8, F4/80, CD11b, CD11c, MHCII, Gr-1, and IFN-γ on day 35 and compared to untreated control mice (n = 4) via flow cytometry analysis. Number of live cells given as a percentage of total isolated cells (B), frequency of leukocytes (CD45+ cells) as a percentage of live cells (C), frequency of cytotoxic T lymphocytes (CD3+ CD8+ cells) as a percentage of total leukocytes (D), fraction of IFN-γ producing CD8+ (CD3+CD8+IFN-γ+) T-cells given as a percentage of total leukocytes (E), fraction of DCs (CD11c+ MHCII+ F4/80− cells) as a percentage of leukocytes (F), and fraction of macrophages (CD11b+ F4/80+ Gr-1− cells) as a percentage of leukocytes (G). H) Histological sections of no-treatment control, local and distant tumors of mice treated with two administrations of ADD-IT on day 35 and stained for H&E (the left first column, whole tumor view) and (second column, magnified view), CD8 (third column), F4/80 (fourth column, whole tumor) and the magnified panels (fifth column), respectively. CD8 and F4/80 staining (brown) identify CD8+ T-cells and macrophages, respectively. Black arrows and red arrowheads denote the necrotic cells and inguinal lymph nodes, respectively. Scale bars are 3 mm for whole tumor image and 100 µm for the magnified image. * p < 0.05, *** p< 0.001, **** p< 0.0001
