
Figure 2.
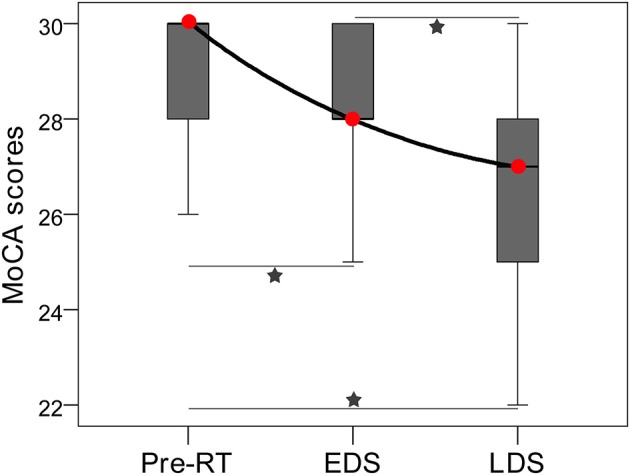
Box plot showing the longitudinal changes in MoCA performance of patients with nasopharyngeal carcinoma. A significant decrease in the MoCA scores was detected among the three stages; there were significant differences in MoCA scores between pre-RT and EDS, between Pre-RT and LDS, and between EDS and LDS. Red circles indicate median MoCA scores of each stages. Pentagrams indicate significant differences with post-hoc Dunnett's tests (P < 0.05). EDS, early-delayed stage; LDS, late-delayed stage; MoCA, Montreal Cognitive Assessment; RT, radiation therapy.