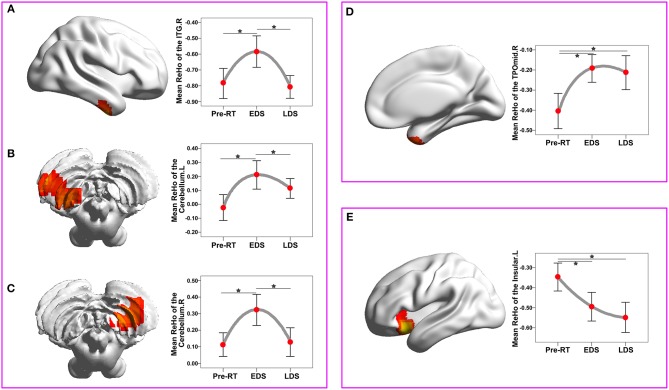
Figure 3.
ReHo changes among the three time points compared with a whole-brain voxel-wise based one-way repeated measure ANOVA and post-hoc tests. There were three patterns of dynamic change for the ReHo index: “increase-decrease-recover” pattern (A–C), with full-recovery in the right cerebellum (A) and right ITGs (B), and with partial-recovery in the left cerebellum (C); “increase” pattern without significant recovery in the right TPOmid (D); “decrease” pattern without significant recovery in the left insula (E). Brain regions were reported at the significant level of a threshold of two-tailed voxel-wise P < 0.01 and cluster level P < 0.05 with Gaussian Random Field correction. Error bars indicate two standard errors, and pentagrams indicate significant differences revealed by ANOVA post-hoc tests with Dunnett's tests (P < 0.05). ANOVA, analysis of variance; EDS, early-delayed stage; L, left; LDS, late-delayed stage; ITG, inferior temporal gyrus; MNI, Montreal Neurological Institute; R, right; ReHo, regional homogeneity; TPOmid, temporal pole: middle temporal gyrus; RT, radiotherapy.

