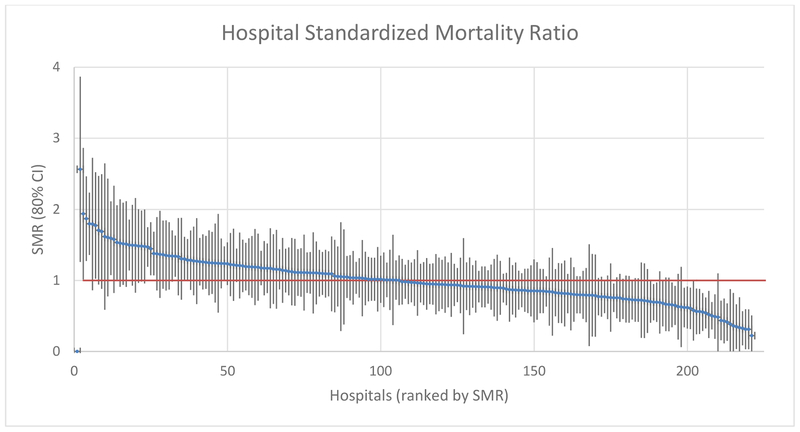
Figure 1: Hospital Standardized Mortality Ratio (SMR).
SMR-based caterpillar plot comparing standardized mortality performance among all acute care hospitals studied in California. Each line is one hospital; vertical bar represents 80% confidence interval. SMR=1.0 implies typical performance relative to the California standard for the types of patients treated at that hospital. SMR >1.0 with 80% CI lower bound above 1.0 is a high-mortality outlier (12 hospitals). SMR <1.0 with 80% CI upper bound below 1.0 is a low-mortality outlier (28 hospitals). For the SMR data that went into creating this chart, please see Supplemental Digital Content 3, Appendix C, http://links.lww.com/TA/B340.

