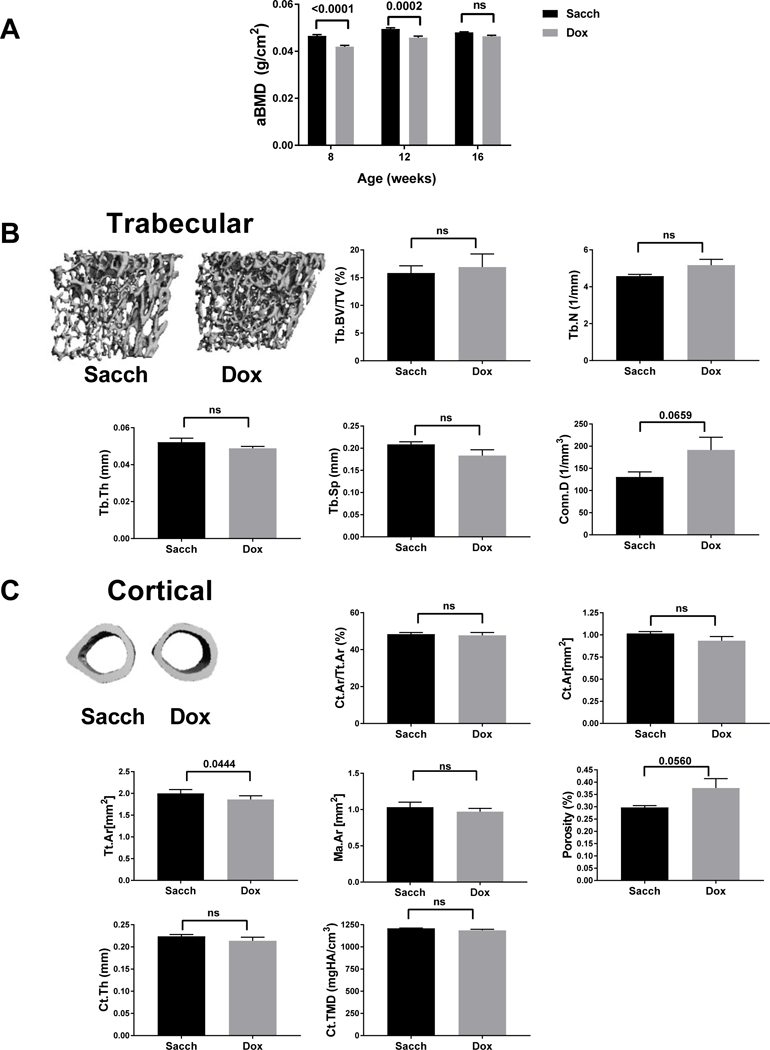
Figure 4: Overexpression of Noct WT showed no significant changes in both trabecular and cortical bone at 16 weeks with Dox treatment.

Noct WT mice were treated with either Sacch or Dox beginning at 4 weeks of age and followed till 16 weeks of age. A) Areal Bone mineral density (aBMD) was measured by DXA at 8, 12 and 16 weeks (n=6–12). B) Representative μCT images of trabecular bone (Tb); followed by femoral microarchitecture trabecular parameters measured at 16 weeks. Tb. BV/TV, Tb.Th, Tb.N, Tb.Sp and Conn.D. C) Representative μCT images of cortical bone (Ct.) and femoral microarchitecture cortical parameters measured Ct.Ar/Tt.Ar, Ct.Ar, Tt.Ar, Ma.Ar, Ct.Porosity, Ct.Th and Ct.TMD are shown. Values represent mean ± SEM of n=4–5. p values are calculated as described in methods section for A and using an unpaired students t-test in GraphPad Prism for B,C.
