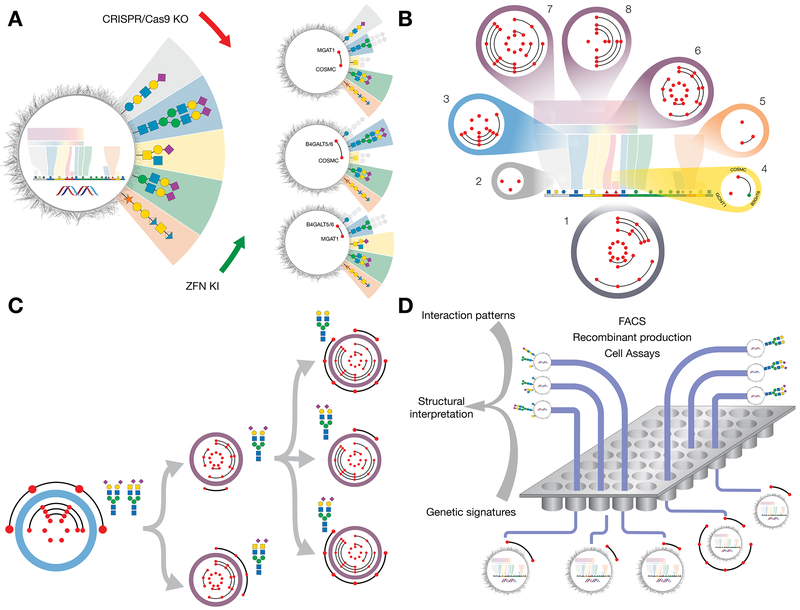
Figure 2. Design and Construction of a Cell-Based Display Platform for the Human Glycome.
(A) Depiction of the KO/KI gene engineering strategy for development of isogenic HEK293 cells with selective loss/gain of glycosylation capacities. Illustrated is how early combinatorial KO (red dots combined by black line) of the glycosyltransferase genes controlling the early steps in glycosphingolipid glycosylation (B4GALT5/6), N-glycosylation (MGAT1), or GalNAc-type O-glycosylation (C1GALT1/COSMC), generate cells with and without elaborated glycan features found on these glycoconjugates. The depicted glycan structures and outcomes of the engineering are simplified to illustrate the truncation effects by greying out.
(B) Depiction of a sublibrary cell strategy for display of glycan features with sublibraries (1-8) covering the principal pathway-specific and pathway-nonspecific glycosylation steps that enable differential display of the following key features: 1) type of glycoconjugates; 2) type of glycosphingolipids; 3) branching and core fucose of N-glycans; 4) core of GalNAc-type O-glycans; 5) chondroitin/dermatin (CS/DS) and heparan sulfate (HS) GAGs; 6) core structures LacNAc and LacDiNAc; 7) capping by α2-3 and α2-6SA; and 8) sialylation by α2-6SA. Red dots in circles of sublibraries represent KO of a glycosyltransferase gene with combinatorial KO shown by lines between genes. Green dots represent KI of a glycosyltransferase gene not endogenously expressed in HEK293 cells.
(C) Design of sublibrary connectivities for display of distinct complex glycan features. Illustrated is the design strategy used to differentially display homogenous N-glycans with LacNAc/LacDiNAc elongation and α2-3/α2-6SA capping. A biantennary N-glycan design (sublibrary 3) was combined with LacNAc or LacDiNAc designs (sublibrary 6) and α2-3SA, α2-6SA, or no SA designs (sublibrary 7). A complete summary of current status of sublibraries and connectivities generated is presented in Table S1.
(D) Graphic depiction of experimental workflows using the cell-based array. Libraries of isogenic cells with known genetic engineering and display of distinct subsets of the human glycome may be used in diverse bioassays and for recombinant production of reporter glycoconjugates for further studies and validation. The readout of these assays generate patterns of interactions (loss/gain), e.g. binding intensities quantified by flow cytometry, and these patterns are translated using the atlas of glycosylation maps (Figure 1) into structural glycan motifs and types of glycoconjugates. Interaction patterns typically include multiple informative datapoints due to the sequential nature of oligosaccharide biosynthesis to strengthen the structural interpretations. Sequential use of sublibraries and additional connectivity engineering are used to simplify workflow and for refinement. See also Figures S3,5 and S6.

