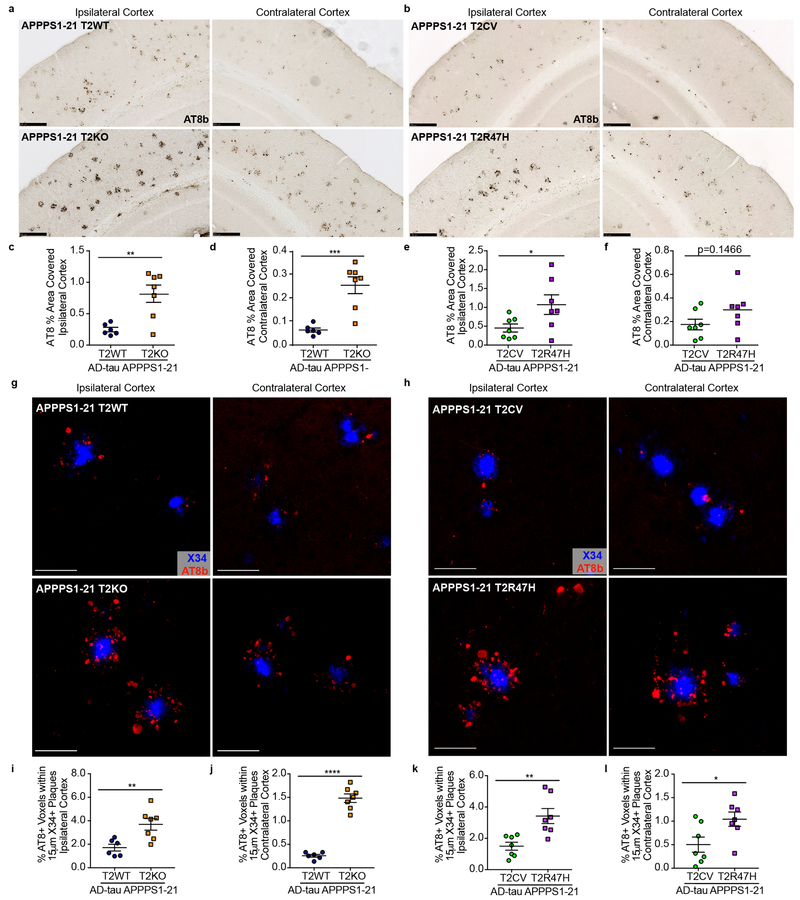
Fig. 1. NP tau pathology is significantly increased with loss of TREM2 function.
a, b, Representative images of AT8-labeled NP tau burden in AD-tau seeded APPPS1-21 T2WT and T2KO (a) or T2CV and T2R47H mice (b). Scale bars 250µm. c, d, e, f, Quantification of AT8 staining in the ipsi and contra cortices of T2WT and T2KO mice (t(11), ipsi **P=0.0039, contra ***P=0.0005) (c,d) or T2CV and T2R47H mice (t(12), ipsi *P=0.0484, contra P=0.1466) (e,f). g,h, Confocal images of cortical AT8+ NP tau (red) around X34+ plaques (blue). Scale bars 50µm. i,j,k,l Quantification of the percent of AT8+ voxels within 15µm of plaques in T2WT and T2KO mice (t(11), ipsi **P=0.0066, contra ***P<0.0001) (i,j) or T2CV and T2R47H mice (t(12), ipsi **P=0.0064, contra *P=0.0311) (k.l). Significance determined by unpaired, two-sided student’s t-test for T2WT (n = 6) and T2KO (n = 7) or T2CV (n = 7) and T2R47H (n = 7). Individual data points are plotted for each group ± standard error of the mean (SEM).

