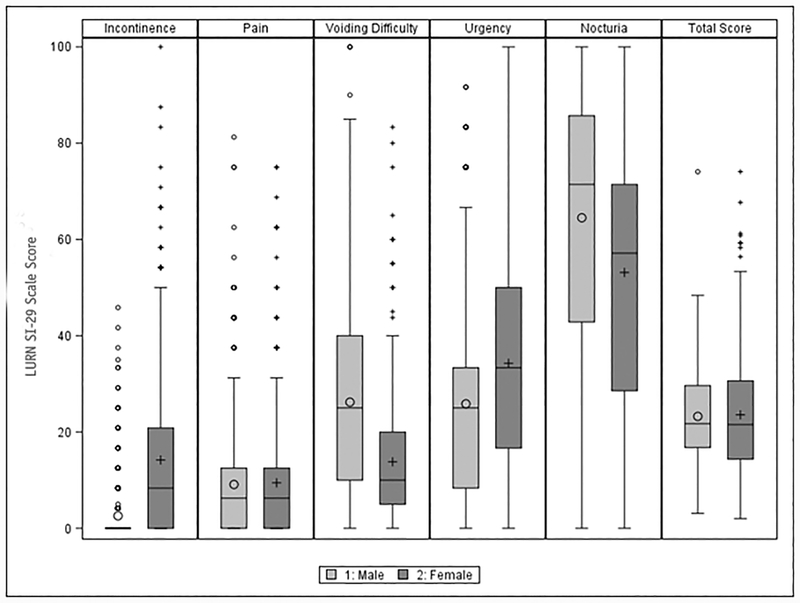
Figure 1:
LURN SI-29 Scales by Sex (n=353 females, 420 males)
Note: Large circles are male means and small circles are male outliers (i.e., greater than 1.5 times the interquartile range). Large pluses are female means, and small pluses are female outliers. The line in the box indicates the median, and the lower and upper edges of the box represent the 25th and 75th percentiles, respectively. The whiskers extend to 1.5 times the interquartile range (i.e. the distance between the 25th and 75th percentiles).

