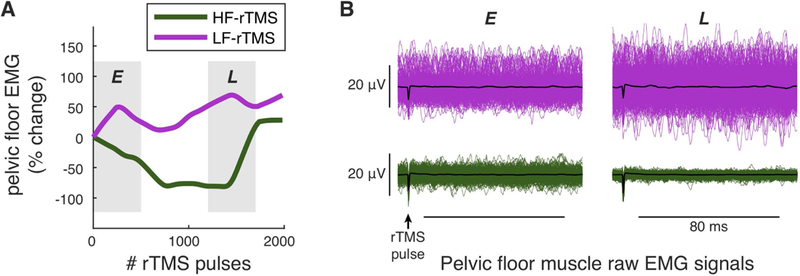
Figure 1. Electromyographic (EMG) assessment of the effects of repetitive transcranial magnetic stimulation (rTMS).

A. Example of estimated time-series of changes in resting pelvic floor muscle (PFM) activity during high frequency (HF-rTMS) or low frequency rTMS (LF-rTMS). B. Four panels of raw demeaned PFM EMG signals, during an earlier (E) or later (L) stage of each rTMS protocol. Each panel shows 500 EMG signals, focusing on the 80-millisecond window after each rTMS pulse where the peak-to-peak difference of each signal was recorded and used to create a time-series of resting PFM activity, as shown in A. In each panel, the mean of the 500 signals is plotted in black, showing no evidence of consistent motor evoked potentials during rTMS. Comparing L to E shows an increase in EMG activity during LF-rTMS (top panels in B) and a decrease in EMG activity during HF-rTMS (bottom panels in B). Data in A and B are from the same participant (P2).
