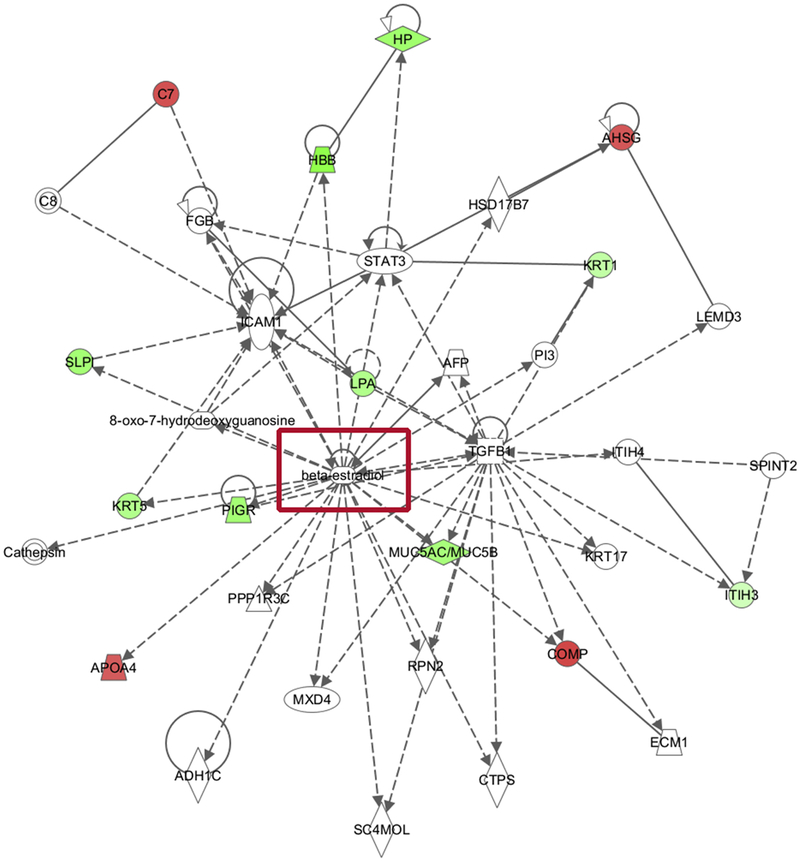
Figure 2.
Pathway Enrichment Network Results of 47 proteins after comparing Post-ADT proteome with failure proteome (from the above Venn diagram (areas G + C) showing beta estradiol (red box) as a key gene implicated in the pathway network analysis (P value less than 10E-30 considered significant).
Green: signifies decrease in protein abundance in the comparison
Red: signifies Increase in protein abundance

