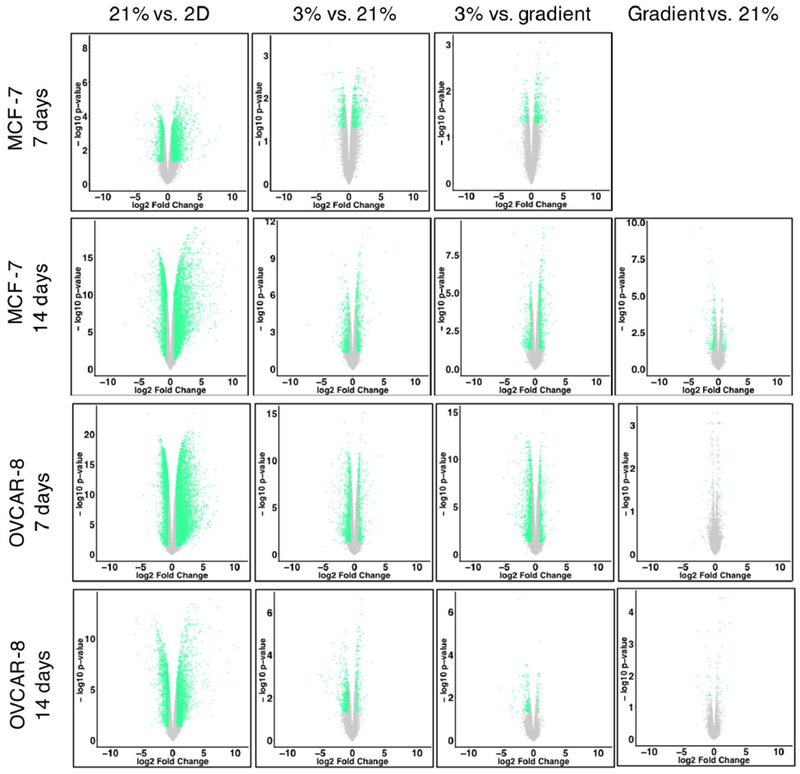
FIGURE 5.

Volcano plots of transcriptomes; genes with a log2 fold change greater than |±0.6| and a False Discovery Rate (FDR) ≤ 0.05 are shown in green, genes not meeting these criteria are grey.

Volcano plots of transcriptomes; genes with a log2 fold change greater than |±0.6| and a False Discovery Rate (FDR) ≤ 0.05 are shown in green, genes not meeting these criteria are grey.