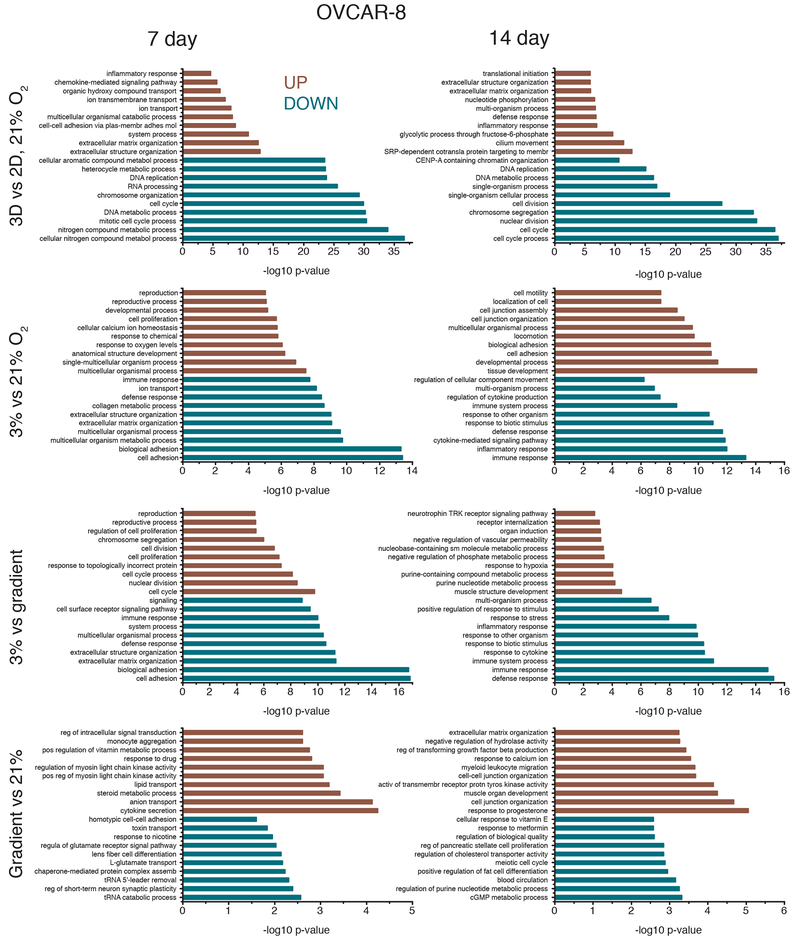
FIGURE 6.
Gene Ontology (GO) biological processes affected by differentially expressed genes for both 7-day and 14-day OVCAR-8 comparisons. Biological processes affected by up-regulated genes are shown in red while processes affected by down-regulated genes are shown in blue. GO biological process lists were generated by GOseq and pruned with REVIGO; the ten processes with the lowest −log10 p-values are shown for 3D vs. 2D 21% O2, 3% vs. 21% O2, 3% vs. gradient, and gradient vs. 21% O2 comparisons.

