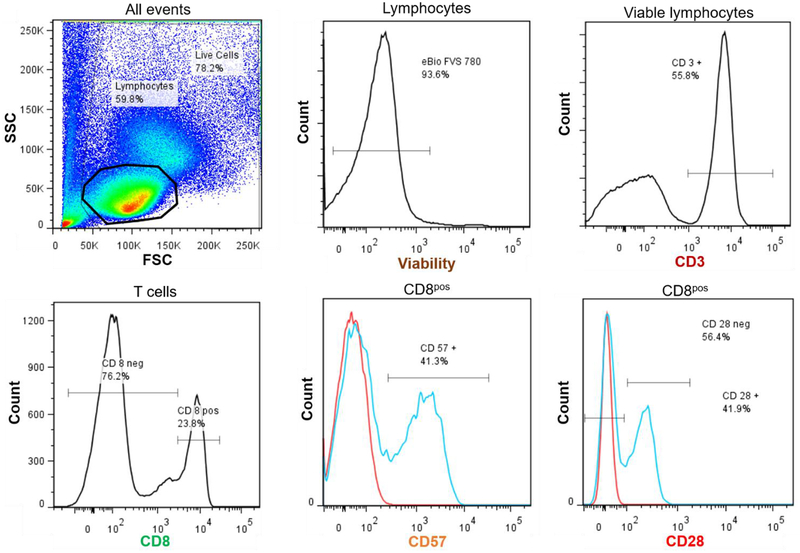
Figure 1.
Illustrative plots of analyzed T cell populations. Lymphocytes were identified on the forward scatter/side scatter plot and calculated as a percentage of live cells. Viable lymphocytes (eBio viability stain) were identified. CD3+ cells were selected for and further identified as CD8+ cells. Proportions of CD8+ T cells expressing CD57+ and CD28− were calculated.

