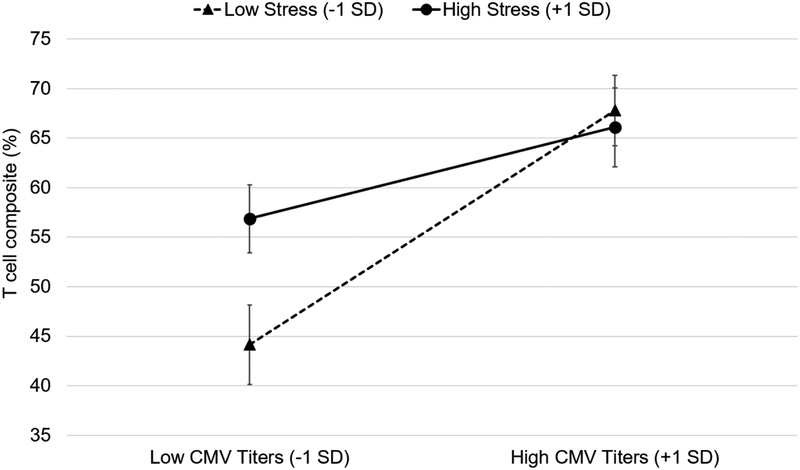
Figure 3.
Simple slopes depicting the between-person differences in cytomegalovirus (CMV) titers and perceived stress on T cell composite (%) in the entire sample. Low CMV titers and low stress are 1 standard deviation (SD) units below the grand means; high CMV titers and high stress are 1 SD units above. Error bars represent standard errors of the estimates. The model was adjusted for lab scientist, CMV extrapolation, time, age at first wave, gender, income, and education.

