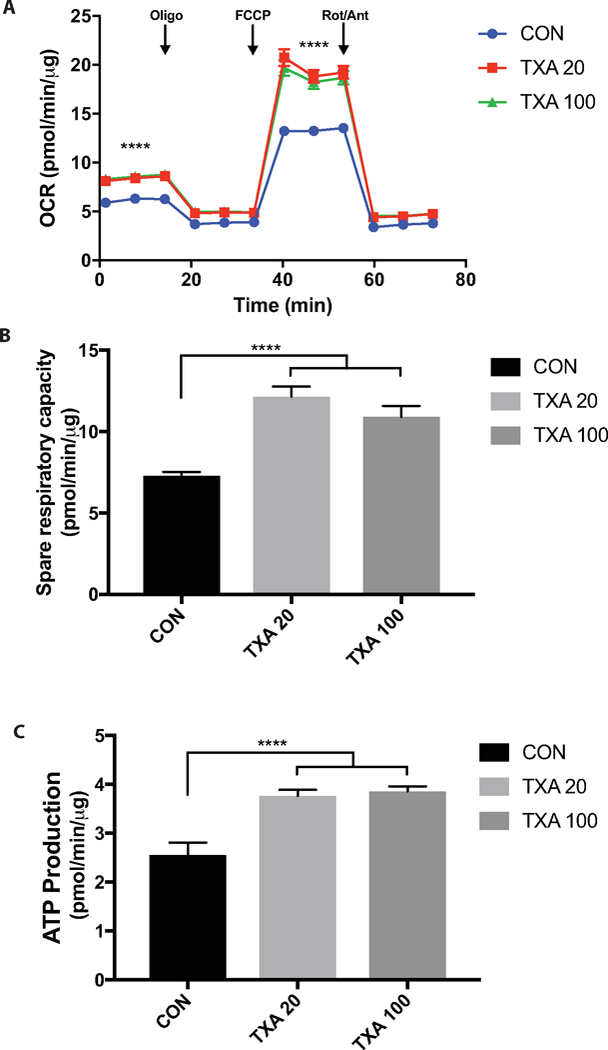
Figure 3. TXA Increases the cells ability to meet energy demands.

A) Mitochondrial Stress Test profile revealing increased basal and maximal respiration with TXA treatment (**** = P <0.0001, ANOVA effect of Treatment). B) Spare respiratory capacity of cells (maximal respiration minus basal respiration) suggestive of the cells increased flexibility to meet energetic demands. C) ATP production indicative of the amount of ATP being produced by the cell through oxidative phosphorylation pathways.
