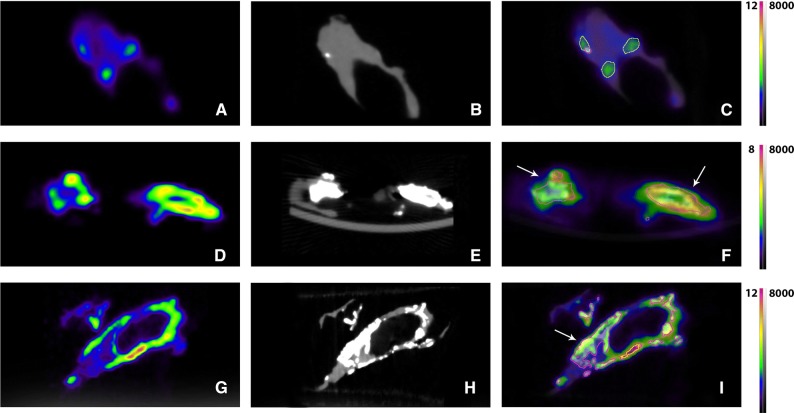
Figure 2.
Sagittal views of 18F-NaF microPET and microCT of human carotid plaques. (A, D, G) PET areas with 18F-NaF uptake. (B, E, H) CT images showing calcification. In image B only one small calcification can be seen in the areas of 18F-NaF uptake. (C, F, I) Fused images. Volumes of interest are drawn around CT calcification areas (white calcification, pink line). The relatively large calcifications (white arrows) show the most intense 18F-NaF uptake at their surface. In the smaller calcifications this cannot be observed due to the limited resolution. Scale PET images in %Inc/g, scale CT images in HU

