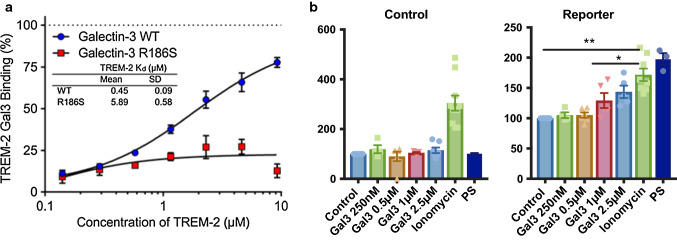
Fig. 6.
Galectin-3 interacts with TREM2 through its carbohydrate-binding domain. a Fluorescent anisotropy assay for galectin-3 (gal3)/TREM2 interaction. Data are presented as % of TREM2–gal3 binding (gal3, WT and mutant gal3 with deficient carbohydrate-binding domain, R186S) and fluorescent probe interaction, by increasing concentrations of TREM2, together with the calculated Kd values for the gal3/TREM2 interaction (n = 2). b Control and DAP12 reporter cell lines were stimulated with increasing concentrations of gal3 (250 nM–2.5 µM), ionomycin and phosphatidylserine (PS). Statistical significance was calculated by Student’s t test or one-way ANOVA with Bonferroni’s post hoc test. *p < 0.05; **p < 0.01. Data are shown as mean ± SD

