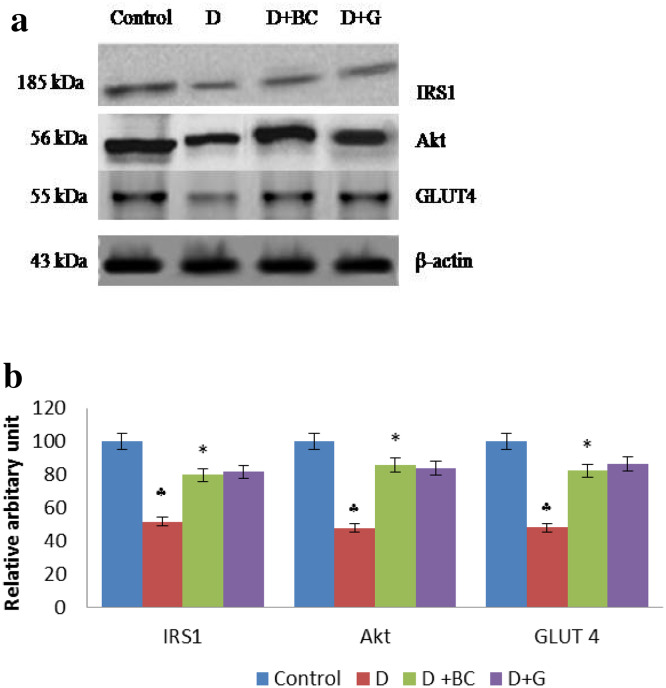
Fig. 5.
Western blot analysis of IRS 1, Akt and GLUT 4 in skeletal muscle of control and treated rats: Diabetic control rats were compared with normal control rats; BC treated diabetic rats were compared with diabetic control rats. a Representative immunoblot analysis. Protein samples (50 μg/lane) resolved on SDS-PAGE was probed with corresponding antibodies. β-Actin was used as loading control. b Densitometric analysis. The mean protein expression from control lysates for five determinations was designated as 100% in the graph. Mean ± SD of six determinants is represented in graph for each group. ♣Significantly different from untreated control (p < 0.05) , *Significantly different from diabetic (D) animals (p < 0.05) (D diabetic; BC berberine chloride; GC Glibenclamide)

