
Fig. 10.
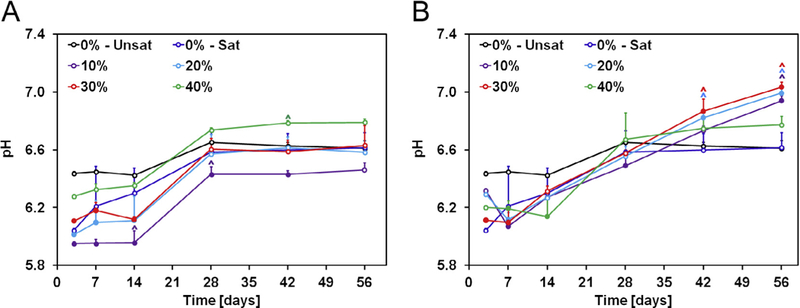
A) Change in pH with time of solutions containing GMP/CPC composites fabricated with four different weight fractions of GMPs (10, 20, 30, and 40%) in the 100–150 μm range. B) Change in pH with time of solutions containing GMP/CPC composites fabricated with four different weight fractions of GMPs (10, 20, 30, and 40%) in the 150–300 μm range. In both panels, 0%-Unsat represents the control CPC group while 0%-Sat involves the use of solution saturated in glucose. Solid circles indicate difference from 0%-Unsat group, while ^ indicates difference from 0%-Unsat group within each time point (n = 4, P < 0.05). Error bars represent the 95% confidence interval in both panels.