
Fig. 11.
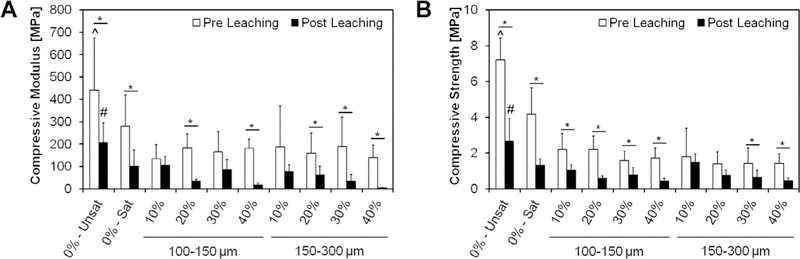
Compressive modulus (A) and compressive strength (B) of different formulations tested upon fabrication (Pre Leaching series) and after 72 h of leaching into PBS at 37 “C (Post Leaching series). 0%-Unsat represents the control CPC group, while 0%-Sat involves the use of a solution saturated in glucose. GMPs were further introduced in the formulations according to two size ranges (100–150 and 150–300 μm) and four weight fractions (10, 20, 30, and 40%). Within each series, ^ and # indicate statistical difference from any other group (P < 0.05), while * indicate differences between Pre and Post leaching within each group. Error bars represent the 95% confidence interval in both panels.