
Fig. 7.
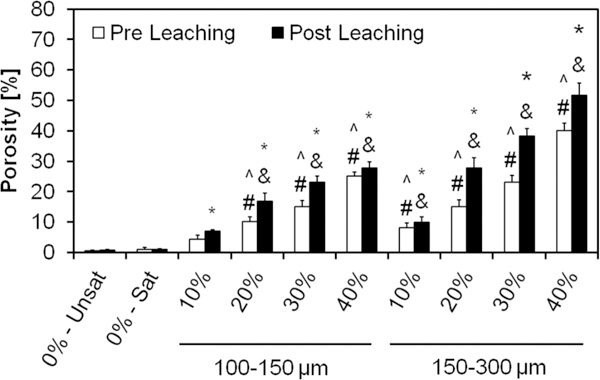
Overall porosity of the GMP/CPC composites evaluated via μCT upon fabrication (Pre Leaching series) and after 72 h of leaching into PBS at 37 °C (Post Leaching series). 0%-Unsat represents the control CPC group, while 0%-Sat involves the use of solution saturated in glucose. GMPs were further introduced in the formulations according to two size ranges (100–150 and 150–300 μm) and four weight fractions (10, 20, 30, and 40%). Within the Pre leaching series, ^ and # denotes significance with respect to 0%-Unsat and 0%-Sat groups, respectively (n = 3, P < 0.05). In the Post leaching series, * and & denote significance with respect to 0%-Unsat and 0%-Sat groups, respectively. In both series the error bars represent the 95% confidence interval. Porosity was increased by the use of GMPs, with larger GMPs imparting a greater increase in porosity than smaller GMPs.