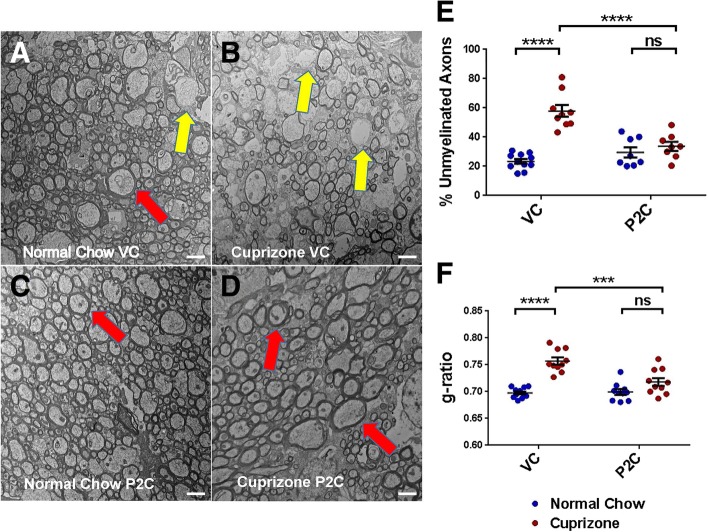
Fig. 2.
Effect of TLR2 tolerance induction on remyelination. a–d Representative EM images from corpus callosum: a “Normal Chow VC”—mice fed for 7 weeks with normal chow and treated for the last 2 weeks with VC. b “Cuprizone VC”—mice fed for 5 weeks with cuprizone, then fed for 2 weeks with normal chow and treated for these last 2 weeks with VC. c “Normal Chow P2C”—mice fed for 7 weeks with normal chow and treated for the last 2 weeks with Pam2CSK4 (P2C). d “Cuprizone P2C”—mice fed for 5 weeks with cuprizone, then fed for 2 weeks with normal chow and treated for these last 2 weeks with P2C. Scale bar = 2 μm. Red arrows depict typical axons with normal myelin thickness. Yellow arrows depict typical axons with decreased myelin thickness. e Percentage of unmyelinated axons as calculated from EM images. f Myelin thickness (g-ratios) as calculated from EM images. For e and f, data points represent individual mice analyzed as described in the “Methods” section. N = 8–10 mice per experimental condition. Error bars represent the mean ± SEM. Statistical differences were assessed by 2-way ANOVA. ***p < 0.001; ****p < 0.0001. For NS comparisons: P2C treated: normal vs cuprizone-fed, p = 0.7912 (e). P2C treated: normal vs cuprizone-fed, p = 0.1486 (f)

