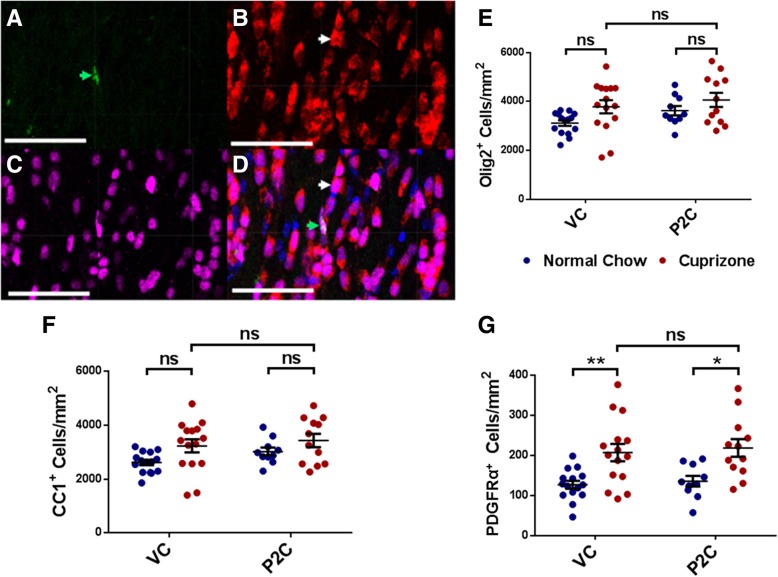
Fig. 3.
Effect of TLR2 tolerance induction on OPC and OL frequency. a–d Overlapping immunohistofluorescent stains of one representative corpus callosum section. a Green = PDGFRα+ cells, b red = CC1+ cells, c magenta = Olig2+ cells, d all images merged; blue = DAPI. In d, the white arrow depicts the example CC1+ cell also seen in b, and the green arrow depicts the example PDGFRα+ cell also seen in a. Scale bars represent 50 μm. e–g Analysis of cell frequency in corpus callosum sections based on co-localization of DAPI+ Olig2+ cells/mm2. e Olig2+ cells/mm2, f Olig2+ CC1+ cells/mm2, g Olig2+ PDGFRα+ cells/mm2. Data points represent individually analyzed sections derived from 4 mice per cohort; 3–4 sections were analyzed from each mouse. N = 12–15 total sections per experimental cohort. Error bars represent the mean ± SEM. Statistical differences were assessed by 2-way ANOVA. *p < 0.05; **p < 0.01. For NS comparisons: e VC treated: normal vs cuprizone-fed, p = 0.1660. P2C treated: normal vs cuprizone-fed, p = 0.7672. Normal chow: VC vs P2C, p = 0.5803. Cuprizone-fed: VC vs P2C, p = 0.9451. f VC treated: normal vs cuprizone-fed, p = 0.1295. P2C treated: normal vs cuprizone-fed, p = 0.7142. Normal chow: VC vs P2C, p = 0.6692. Cuprizone-fed: VC vs P2C, p = 0.9772. g Cuprizone-fed: VC vs P2C, p = 0.9983

