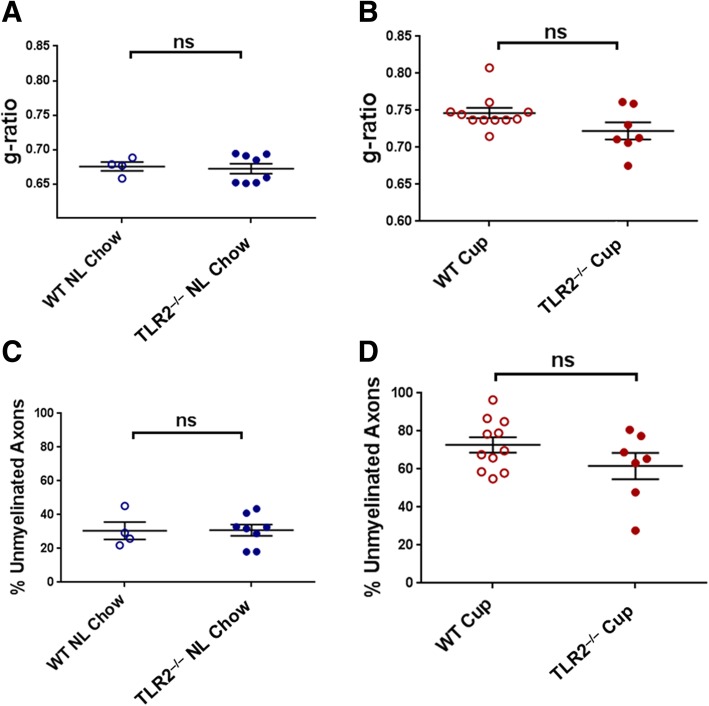
Fig. 5.
Demyelination in WT versus TLR2−/− mice after 5 weeks on cuprizone. WT and TLR2−/− mice were fed either cuprizone or normal chow for 5 weeks, sacrificed, and myelin status in the corpus callosum was analyzed by EM. a Myelin thickness (g-ratios) of normal (“NL”) chow-fed WT versus TLR2−/− mice. b Myelin thickness of cuprizone (“Cup”)-fed WT versus TLR2−/− mice. c Percentage of unmyelinated axons in normal chow-fed WT versus TLR2−/− mice. d Percentage of unmyelinated axons in cuprizone-fed WT versus TLR2−/− mice. Data points represent individual mice analyzed as described in Methods. N = 4–11 mice per experimental condition. Error bars represent the mean ± SEM. Statistical differences were assessed by unpaired t test with Welch’s correction or Mann-Whitney analysis. For NS comparisons: a NL chow: WT vs TLR2−/−, p > 0.9999. b Cuprizone-fed: WT vs TLR2−/−, p = 0.1020. c NL chow: WT vs TLR2−/−, p = 0.9660. d Cuprizone-fed: WT vs TLR2−/−, p = 0.1941

